- Phân tích
- Tin tức và các công cụ
- Tin tức thị trường
- Gold Price Forecast: XAU/USD printed a daily close above $1,800, bull’s eye $1,834
Gold Price Forecast: XAU/USD printed a daily close above $1,800, bull’s eye $1,834
- On Monday, gold advanced $17 during the day, despite risk-on market sentiment.
- Gold has rallied for five consecutive days, climbing almost $50 until the current market price.
- XAU/USD: The daily chart is tilted to the upside, but strong resistance at $1,834 lies ahead.
- US 10-year T-bond yield: A break below 1.55% could push gold prices toward $1,834 and beyond.
Gold (XAU/USD) is barely flat as the New York session winds down and the Asian session begins, is trading at $1,807.68 during the day at the time of writing. On Monday, the non-yielding metal rose almost 1%, from $1,792 to $1,810, amid lower US T-bond yields, with the 10-year yield dropping from 1.678% to 1.633%.
Risk-on market sentiment prevailed during the Monday New York session as portrayed by US stock indices rising between 0.18% and 1.04%, gaining follow-through in the Asian session. Equity futures in Asia climb between 0.12% and 0.31%, except for the FTSE China A 50, down some 0.30%.
Gold reached five days in a row in advance; though the gains have been minimal, the price steadily climbed towards $1,800. The Federal Reserve entered the blackout period until the November 2-3 meeting, when investors expect the announcement of the bond tapering program. Those expectations kept gold from a steep upward move, as the market cautiously weighs inflationary pressures and the possibility of higher rates in the US.
XAU/USD Price Forecast: Technical outlook
Daily chart
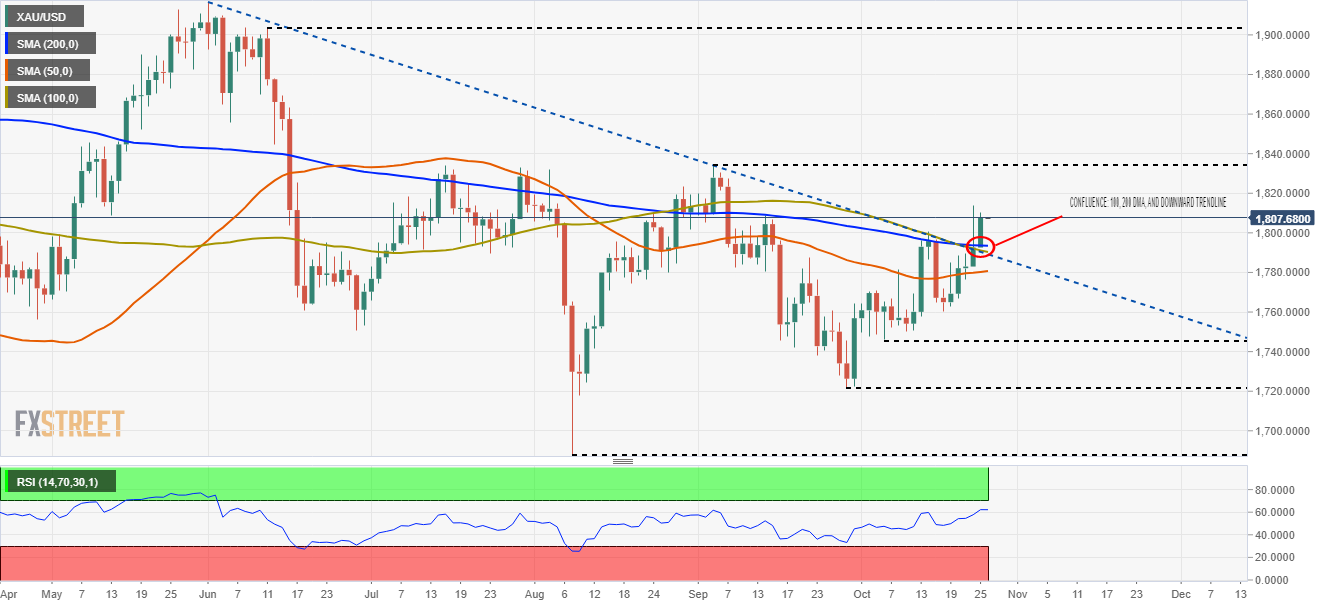
On Monday, gold (XAU/USD) broke a five-month-old downward slope trendline along with the confluence of the 100 and the 200-day moving averages (DMA’s), printing a daily close above $1,800 for the first time since September 8. The abovementioned could well be a strong signal that the yellow-metal might be headed toward higher prices, but the September 3 high at $1,834 would be the first resistance level to surpass on its way towards $1,900. In case of that outcome, there would be nothing on the $1,900 path.
On the flip side, a reversal towards $1,780 could exert additional downward pressure to XAU/USD, leaving $1,746 as the first support area. A clear break of the latter could expose essential support areas—the September 29 low at $1,721, followed by the August 9 low at $1,687.
The Relative Strength Index (RSI) at 62 above the 50-midline supports the upside bias, but the slope is flattish so that gold might be headed for consolidation.
US Government Bond 10-year Treasury yield
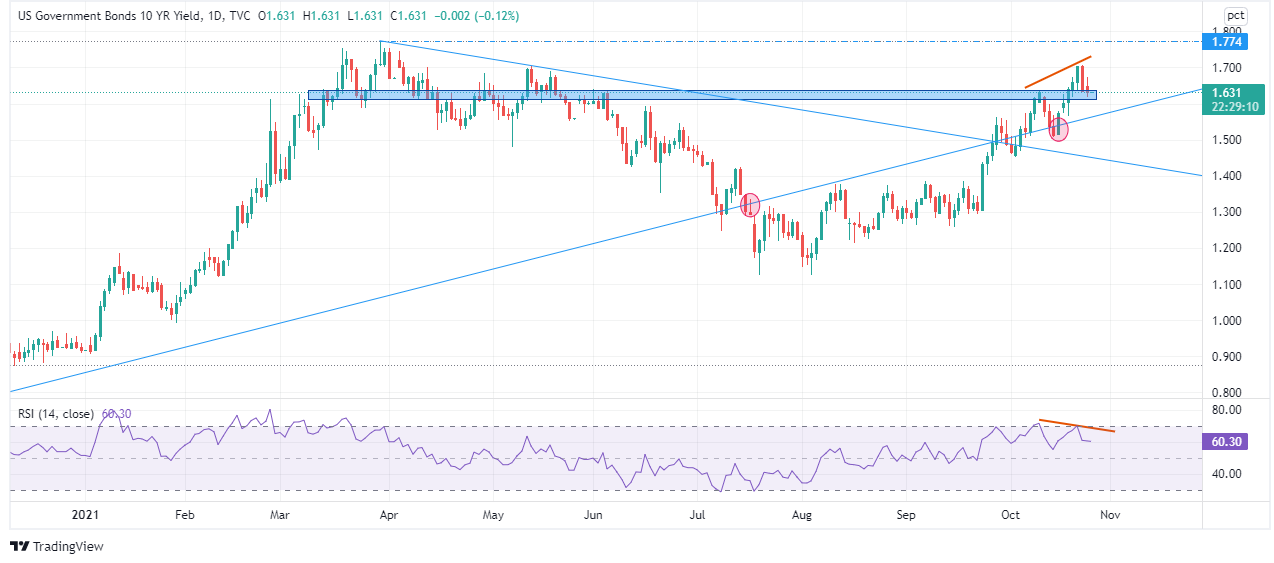
The daily chart of the US 10-year Treasury yield depicts a negative divergence with the yield pushing higher, while the Relative Strength Index tops is printing lower highs.
The abovementioned suggest that the US 10-year bond coupon might be headed lower, but at press time, it is testing an area supported for about four months. Also, around the 1.55% area lies an upward trendline broken to the downside in July, but reclaimed its support status on October 15, when the 10-year reached a high of 1.579%. Hence, confirmation of the negative divergence could open the way for another leg-down in yields, thus propelling gold prices higher.


© 2000-2026. Bản quyền Teletrade.
Trang web này được quản lý bởi Teletrade D.J. LLC 2351 LLC 2022 (Euro House, Richmond Hill Road, Kingstown, VC0100, St. Vincent and the Grenadines).
Thông tin trên trang web không phải là cơ sở để đưa ra quyết định đầu tư và chỉ được cung cấp cho mục đích làm quen.
Giao dịch trên thị trường tài chính (đặc biệt là giao dịch sử dụng các công cụ biên) mở ra những cơ hội lớn và tạo điều kiện cho các nhà đầu tư sẵn sàng mạo hiểm để thu lợi nhuận, tuy nhiên nó mang trong mình nguy cơ rủi ro khá cao. Chính vì vậy trước khi tiến hành giao dịch cần phải xem xét mọi mặt vấn đề chấp nhận tiến hành giao dịch cụ thể xét theo quan điểm của nguồn lực tài chính sẵn có và mức độ am hiểu thị trường tài chính.
Sử dụng thông tin: sử dụng toàn bộ hay riêng biệt các dữ liệu trên trang web của công ty TeleTrade như một nguồn cung cấp thông tin nhất định. Việc sử dụng tư liệu từ trang web cần kèm theo liên kết đến trang teletrade.vn. Việc tự động thu thập số liệu cũng như thông tin từ trang web TeleTrade đều không được phép.
Xin vui lòng liên hệ với pr@teletrade.global nếu có câu hỏi.
ngân hàng