- Phân tích
- Tin tức và các công cụ
- Tin tức thị trường
- Gold Price Forecast: XAU/USD needs to crack $1781 for further downside – Confluence Detector
Gold Price Forecast: XAU/USD needs to crack $1781 for further downside – Confluence Detector
- Gold price extends losses amid resurgent US dollar demand.
- Market sentiment sours ahead of the critical US macro data.
- Gold bears and bulls fight over $1,800, focus shifts to US GDP.
The US dollar resurgence amid risk-off markets at full steam has once again taken the wind out of the gold price rally, downing the bright metal for the second day in a row. Investors liquidate their USD shorts and reposition themselves ahead of the critical US Q3 GDP report due later this week. Further, rising global inflationary pressures and their potential negative impact on the economic recovery also spurs the safe-haven bids in the dollar at gold’s expense. However, falling US Treasury yields could help put a floor under gold price.
Read: Gold Price Forecast: 50-DMA to test bulls’ commitments again, as focus shifts to US data, central banks
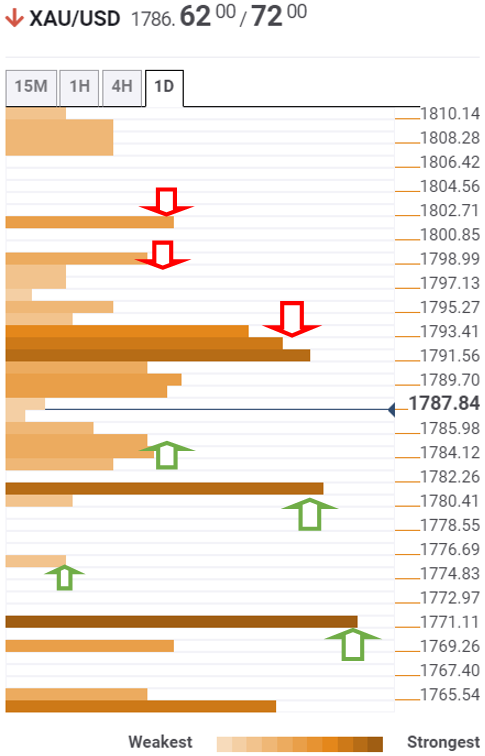
Gold Price: Key levels to watch
The Technical Confluences Detector shows that gold is heading south to test the $1784 demand area, which is the intersection of the SMA200 one-hour, SMA10 one-day and SMA50 four-hour.
Sellers need a strong foothold below $1781 to extend the additional downside. That level is the confluence of the Fibonacci 61.8% one-week and pivot point one-day S1.
Further south, the SMA100 four-hour at $1777 could come to the buyers’ rescue. The next powerful support awaits at $1772, the Bollinger Band one-day Middle.
Alternatively, gold bulls will run into immediate supply pressure at a dense cluster of healthy resistance levels around $1793. Around that region, the SMA5 one-day, SMA200 one-day, Fibonacci 38.2% one-day and Fibonacci 61.8% one-month coincide.
Gold bulls will next target $1799, the meeting point of the Fibonacci 61.8% one-day and SMA50 one-hour.
The Fibonacci 23.6% one-week at $1801 will be the level to beat for gold optimists.
Here is how it looks on the tool
About Technical Confluences Detector
The TCD (Technical Confluences Detector) is a tool to locate and point out those price levels where there is a congestion of indicators, moving averages, Fibonacci levels, Pivot Points, etc. If you are a short-term trader, you will find entry points for counter-trend strategies and hunt a few points at a time. If you are a medium-to-long-term trader, this tool will allow you to know in advance the price levels where a medium-to-long-term trend may stop and rest, where to unwind positions, or where to increase your position size.


© 2000-2026. Bản quyền Teletrade.
Trang web này được quản lý bởi Teletrade D.J. LLC 2351 LLC 2022 (Euro House, Richmond Hill Road, Kingstown, VC0100, St. Vincent and the Grenadines).
Thông tin trên trang web không phải là cơ sở để đưa ra quyết định đầu tư và chỉ được cung cấp cho mục đích làm quen.
Giao dịch trên thị trường tài chính (đặc biệt là giao dịch sử dụng các công cụ biên) mở ra những cơ hội lớn và tạo điều kiện cho các nhà đầu tư sẵn sàng mạo hiểm để thu lợi nhuận, tuy nhiên nó mang trong mình nguy cơ rủi ro khá cao. Chính vì vậy trước khi tiến hành giao dịch cần phải xem xét mọi mặt vấn đề chấp nhận tiến hành giao dịch cụ thể xét theo quan điểm của nguồn lực tài chính sẵn có và mức độ am hiểu thị trường tài chính.
Sử dụng thông tin: sử dụng toàn bộ hay riêng biệt các dữ liệu trên trang web của công ty TeleTrade như một nguồn cung cấp thông tin nhất định. Việc sử dụng tư liệu từ trang web cần kèm theo liên kết đến trang teletrade.vn. Việc tự động thu thập số liệu cũng như thông tin từ trang web TeleTrade đều không được phép.
Xin vui lòng liên hệ với pr@teletrade.global nếu có câu hỏi.
ngân hàng