- Phân tích
- Tin tức và các công cụ
- Tin tức thị trường
- Gold Price Forecast: XAU/USD bounces but $1800 appears elusive ahead of a Big week – Confluence Detector
Gold Price Forecast: XAU/USD bounces but $1800 appears elusive ahead of a Big week – Confluence Detector
- Gold price rebounds but not out of the woods yet amid firmer USD, yields.
- Gold’s fate hinges on the all-important Fed decision and US NFP release.
- XAU/USD’s drop below $1,780 an ominous sign ahead of Fed.
Gold bulls are coming up for the last dance ahead of the all-important US Federal Reserve (Fed) policy decision, with odds of hints of an earlier-than-expected rate hike higher after Friday’s PCE inflation came in hotter. The US dollar remains broadly higher in tandem with the Treasury yields starting out a fresh month. The US Nonfarm Payrolls (NFP) release this Friday will also help determine the next direction in gold price.
Read: Gold Chart of the Week: Possible bear scalp for the open, longer-term outlook is mixed
Gold Price: Key levels to watch
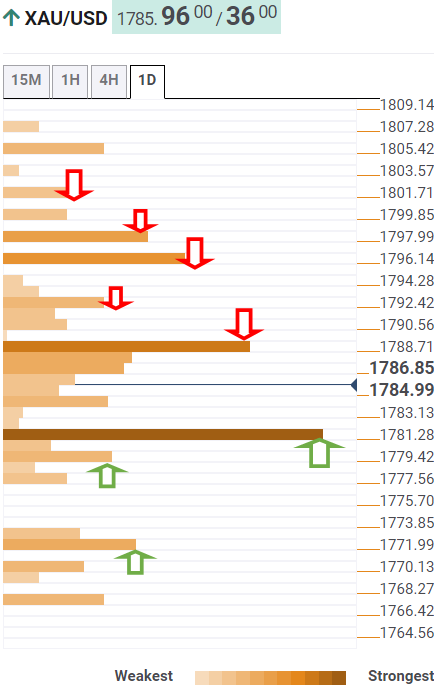
The Technical Confluences Detector shows that gold is approaching powerful resistance at $1789 on its road to recovery. That hurdle is the convergence of the Fibonacci 38.2% one-month and SMA100 one-day.
A sustained move above the latter is needed to take on the $1792 barrier, which is the confluence of the SMA200 one-day and SMA10 four-hour.
Up next, gold bulls eye $1796, the intersection of the SMA100 one-hour, SMA5 one-day and Fibonacci 61.8% one-week.
The Fibonacci 23.6% one-month at $1798 will be on the buyers’ radars if the bullish momentum remains unabated.
The meeting point of the previous day’s high and pivot point one-day R1 around $1801 will be the level to beat for gold bulls.
On the flip side, strong support is now seen at the previous resistance at $1782, where the SMA50 one-day and Fibonacci 23.6% one-week merge.
The next critical demand area is aligned around $1778-$1780, where the SMA100 four-hour, Fibonacci 23.6% one-day and the previous low four-hour coincide.
Further south, the confluence of the previous day’s low and Fibonacci 61.8% one-month at $1772 will test the bullish commitments.
Here is how it looks on the tool
About Technical Confluences Detector
The TCD (Technical Confluences Detector) is a tool to locate and point out those price levels where there is a congestion of indicators, moving averages, Fibonacci levels, Pivot Points, etc. If you are a short-term trader, you will find entry points for counter-trend strategies and hunt a few points at a time. If you are a medium-to-long-term trader, this tool will allow you to know in advance the price levels where a medium-to-long-term trend may stop and rest, where to unwind positions, or where to increase your position size.


© 2000-2026. Bản quyền Teletrade.
Trang web này được quản lý bởi Teletrade D.J. LLC 2351 LLC 2022 (Euro House, Richmond Hill Road, Kingstown, VC0100, St. Vincent and the Grenadines).
Thông tin trên trang web không phải là cơ sở để đưa ra quyết định đầu tư và chỉ được cung cấp cho mục đích làm quen.
Giao dịch trên thị trường tài chính (đặc biệt là giao dịch sử dụng các công cụ biên) mở ra những cơ hội lớn và tạo điều kiện cho các nhà đầu tư sẵn sàng mạo hiểm để thu lợi nhuận, tuy nhiên nó mang trong mình nguy cơ rủi ro khá cao. Chính vì vậy trước khi tiến hành giao dịch cần phải xem xét mọi mặt vấn đề chấp nhận tiến hành giao dịch cụ thể xét theo quan điểm của nguồn lực tài chính sẵn có và mức độ am hiểu thị trường tài chính.
Sử dụng thông tin: sử dụng toàn bộ hay riêng biệt các dữ liệu trên trang web của công ty TeleTrade như một nguồn cung cấp thông tin nhất định. Việc sử dụng tư liệu từ trang web cần kèm theo liên kết đến trang teletrade.vn. Việc tự động thu thập số liệu cũng như thông tin từ trang web TeleTrade đều không được phép.
Xin vui lòng liên hệ với pr@teletrade.global nếu có câu hỏi.
ngân hàng