- Phân tích
- Tin tức và các công cụ
- Tin tức thị trường
- Gold Price Forecast: Fed-led rebound needs acceptance above $1782 – Confluence Detector
Gold Price Forecast: Fed-led rebound needs acceptance above $1782 – Confluence Detector
- Gold price stalls the recovery amid a bounce in the USD, yields.
- The Fed tapers by $15 billion, stays patient on rate hikes.
- Gold Price Forecast: Firmer bearish case once below 1,756.60.
The Fed’s tapering occurred as expected and triggered a rebound in gold price, as a $15 billion worth of taper was well priced-in. Further, Fed Chair Jerome Powell’s patient stance on the interest rate hikes offered additional zest to gold bulls. However, the renewed upswing in the US Treasury yields amid rising inflation expectations put a fresh bid under the greenback, checking gold’s recovery from a three-week trough of $1759. Attention now turns towards Friday’s US NFP release for fresh gold price direction.
Read: Federal Reserve tapers, Treasury rates rise and markets yawn
Gold Price: Key levels to watch
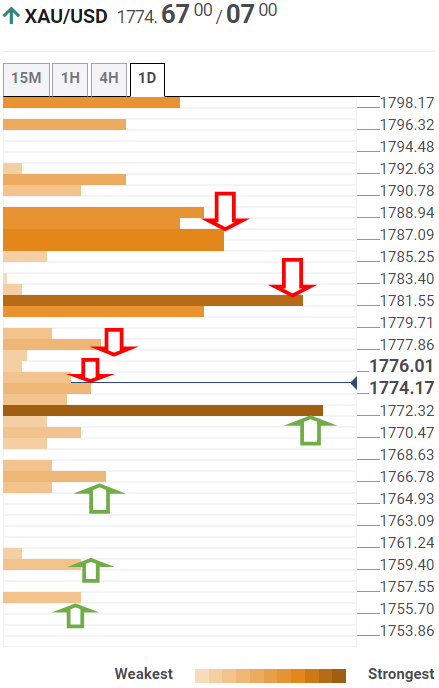
The Technical Confluences Detector shows that gold is easing towards the strong support at $1772, the intersection of the previous week’s low and Fibonacci 61.8% one-month.
The next relevant support is environed at $1770, the Fibonacci 38.2% one-day.
If the downside momentum accelerates, then sellers will target the pivot point one-week S1 at $1767.
The previous day’s low of $1759 will be on the bears’ radars on the extended decline. Further south, the pivot point one-day S1 at $157 will be challenged.
Alternatively, the Fibonacci 61.8% one-day at $1777 will test the immediate upside attempts, above which powerful resistance around $1782 will come into play.
That level is the confluence of the SMA50 one-day, Fibonacci 23.6% one-week and SMA10 four-hour.
A bunch of healthy resistance levels around $1788 is critical for gold bulls to take out should the recovery extend momentum.
The price area is the convergence of the previous day’s high, Fibonacci 38.2% one-month, SMA100 one-day and pivot point one-day R1.
Here is how it looks on the tool
About Technical Confluences Detector
The TCD (Technical Confluences Detector) is a tool to locate and point out those price levels where there is a congestion of indicators, moving averages, Fibonacci levels, Pivot Points, etc. If you are a short-term trader, you will find entry points for counter-trend strategies and hunt a few points at a time. If you are a medium-to-long-term trader, this tool will allow you to know in advance the price levels where a medium-to-long-term trend may stop and rest, where to unwind positions, or where to increase your position size.


© 2000-2026. Bản quyền Teletrade.
Trang web này được quản lý bởi Teletrade D.J. LLC 2351 LLC 2022 (Euro House, Richmond Hill Road, Kingstown, VC0100, St. Vincent and the Grenadines).
Thông tin trên trang web không phải là cơ sở để đưa ra quyết định đầu tư và chỉ được cung cấp cho mục đích làm quen.
Giao dịch trên thị trường tài chính (đặc biệt là giao dịch sử dụng các công cụ biên) mở ra những cơ hội lớn và tạo điều kiện cho các nhà đầu tư sẵn sàng mạo hiểm để thu lợi nhuận, tuy nhiên nó mang trong mình nguy cơ rủi ro khá cao. Chính vì vậy trước khi tiến hành giao dịch cần phải xem xét mọi mặt vấn đề chấp nhận tiến hành giao dịch cụ thể xét theo quan điểm của nguồn lực tài chính sẵn có và mức độ am hiểu thị trường tài chính.
Sử dụng thông tin: sử dụng toàn bộ hay riêng biệt các dữ liệu trên trang web của công ty TeleTrade như một nguồn cung cấp thông tin nhất định. Việc sử dụng tư liệu từ trang web cần kèm theo liên kết đến trang teletrade.vn. Việc tự động thu thập số liệu cũng như thông tin từ trang web TeleTrade đều không được phép.
Xin vui lòng liên hệ với pr@teletrade.global nếu có câu hỏi.
ngân hàng