- Phân tích
- Tin tức và các công cụ
- Tin tức thị trường
- Gold Price Forecast: XAU/USD’s path of least resistance appears up, $1834 still eyed – Confluence Detector
Gold Price Forecast: XAU/USD’s path of least resistance appears up, $1834 still eyed – Confluence Detector
- Gold price retreats from two-month highs, awaits US inflation figures.
- USD rebounds with Treasury yields, restricts gold’s bullish momentum.
- Gold price turns bullish on falling bond yields, technical breakout.
Gold price is off the two-month highs but maintains its bullish momentum, as September highs of $1834 remains in sight. Gold price continues to remain underpinned by the market uncertainty over the next policy move by the Fed after Chair Jerome Powell said they are patient on rate hikes a week ago. The bright metal remains at the mercy of the dynamics in the US dollar and the Treasury yields, as investors await the US inflation data for the next direction in gold price.
Read: Gold Price Forecast: XAU/USD seems poised to challenge $1,832-34 supply zone
Gold Price: Key levels to watch
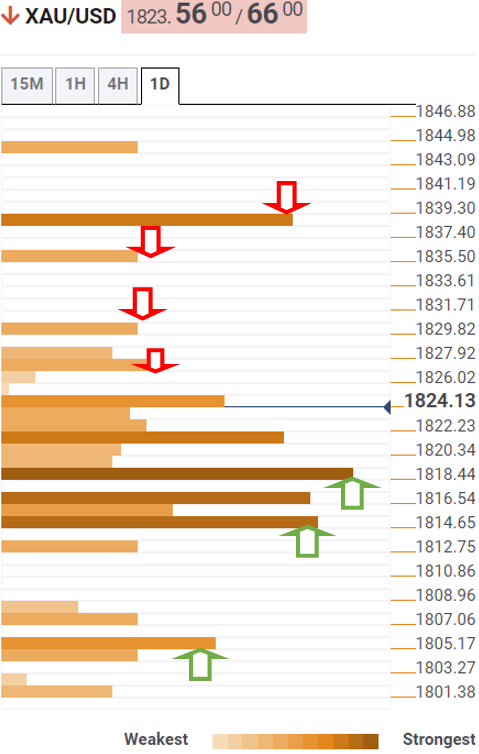
The Technical Confluences Detector shows that the latest leg down in gold price is seen testing strong bids at $1822, which is the convergence of the Bollinger Band one-day Upper and Fibonacci 38.2% one-day.
The immediate downside is guarded by the confluence of the previous week’s high and Fibonacci 61.8% one-day at $1818.
If the selling momentum intensifies, then powerful support around $1815 will be put to test. That level is the intersection of the previous month’s high, pivot point one-month R1 and pivot point one-day S1.
Further south, the Fibonacci 23.6% one-week at $1805 will come into play.
On the flip side, buying resurgence could see a fresh rally back towards the two-month tops of $1827, above which the pivot point one-day R1 at $1830 will get probed.
The next bullish target is envisioned at $1834, September highs. The pivot point one-week R1 at $1839 will offer fierce resistance to gold optimists.
Here is how it looks on the tool
About Technical Confluences Detector
The TCD (Technical Confluences Detector) is a tool to locate and point out those price levels where there is a congestion of indicators, moving averages, Fibonacci levels, Pivot Points, etc. If you are a short-term trader, you will find entry points for counter-trend strategies and hunt a few points at a time. If you are a medium-to-long-term trader, this tool will allow you to know in advance the price levels where a medium-to-long-term trend may stop and rest, where to unwind positions, or where to increase your position size.


© 2000-2026. Bản quyền Teletrade.
Trang web này được quản lý bởi Teletrade D.J. LLC 2351 LLC 2022 (Euro House, Richmond Hill Road, Kingstown, VC0100, St. Vincent and the Grenadines).
Thông tin trên trang web không phải là cơ sở để đưa ra quyết định đầu tư và chỉ được cung cấp cho mục đích làm quen.
Giao dịch trên thị trường tài chính (đặc biệt là giao dịch sử dụng các công cụ biên) mở ra những cơ hội lớn và tạo điều kiện cho các nhà đầu tư sẵn sàng mạo hiểm để thu lợi nhuận, tuy nhiên nó mang trong mình nguy cơ rủi ro khá cao. Chính vì vậy trước khi tiến hành giao dịch cần phải xem xét mọi mặt vấn đề chấp nhận tiến hành giao dịch cụ thể xét theo quan điểm của nguồn lực tài chính sẵn có và mức độ am hiểu thị trường tài chính.
Sử dụng thông tin: sử dụng toàn bộ hay riêng biệt các dữ liệu trên trang web của công ty TeleTrade như một nguồn cung cấp thông tin nhất định. Việc sử dụng tư liệu từ trang web cần kèm theo liên kết đến trang teletrade.vn. Việc tự động thu thập số liệu cũng như thông tin từ trang web TeleTrade đều không được phép.
Xin vui lòng liên hệ với pr@teletrade.global nếu có câu hỏi.
ngân hàng