- Phân tích
- Tin tức và các công cụ
- Tin tức thị trường
- Gold Price Forecast: Battle lines well-defined for XAU/USD, with eyes on Fed, yields – Confluence Detector
Gold Price Forecast: Battle lines well-defined for XAU/USD, with eyes on Fed, yields – Confluence Detector
- Gold price rebounds but not out of the woods yet, focus on yields.
- Gold bull-bear tug-of-war likely to unfold ahead of Fed minutes.
- Gold could stage a deep correction if $1,850 becomes resistance.
Gold is looking to snap its three-day downtrend, attempting a bounce above the $1,800 mark amid a minor pullback in the US Treasury yields. A corrective upside in gold price cannot be ruled out ahead of Wednesday’s US data dump and FOMC minutes, as markets reposition after the biggest daily loss incurred since mid-September.
Gold price tumbled 2% on Monday after Jerome Powell’s renomination as the Fed Chair triggered a sharp rally in the US Treasury yields on expectations of a faster pace of Fed’s tapering.
Read: Gold Price Forecast: XAU/USD eyes dead cat bounce towards $1,830 amid oversold RSI, focus on yields
Gold Price: Key levels to watch
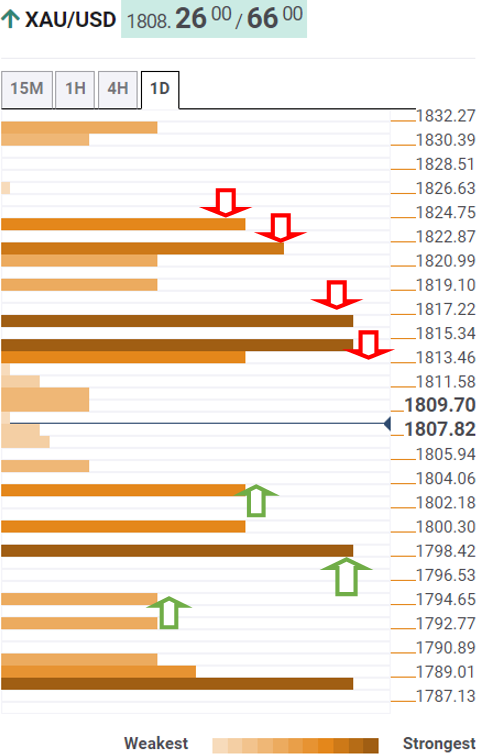
The Technical Confluences Detector shows that the gold price is retreating towards the previous day’s low of $1,802.
The psychological $1,800 threshold will gain the sellers’ attention on a sustained move lower. At that level, the pivot point one-week S3 coincides.
The Fibonacci 23.6% one-month at $1,798 will be a tough nut to crack for gold bears.
If that caves in, then powerful support around $1,793 will challenge the bullish commitments. That point is the intersection of the SMA100 and SMA200 one-day.
Alternatively, stiff resistance is seen around $1,814, which is the convergence of the previous month’s high, Fibonacci 23.6% one-day and Bollinger Band four-hour Lower.
Acceptance above the latter will threaten the immediate cap at $1,817, the pivot point one-month R1.
The next significant upside barrier is envisioned at $1,821, the confluence of the pivot point one-week S2 and Fibonacci 38.2% one-day.
Here is how it looks on the tool
About Technical Confluences Detector
The TCD (Technical Confluences Detector) is a tool to locate and point out those price levels where there is a congestion of indicators, moving averages, Fibonacci levels, Pivot Points, etc. If you are a short-term trader, you will find entry points for counter-trend strategies and hunt a few points at a time. If you are a medium-to-long-term trader, this tool will allow you to know in advance the price levels where a medium-to-long-term trend may stop and rest, where to unwind positions, or where to increase your position size.


© 2000-2026. Bản quyền Teletrade.
Trang web này được quản lý bởi Teletrade D.J. LLC 2351 LLC 2022 (Euro House, Richmond Hill Road, Kingstown, VC0100, St. Vincent and the Grenadines).
Thông tin trên trang web không phải là cơ sở để đưa ra quyết định đầu tư và chỉ được cung cấp cho mục đích làm quen.
Giao dịch trên thị trường tài chính (đặc biệt là giao dịch sử dụng các công cụ biên) mở ra những cơ hội lớn và tạo điều kiện cho các nhà đầu tư sẵn sàng mạo hiểm để thu lợi nhuận, tuy nhiên nó mang trong mình nguy cơ rủi ro khá cao. Chính vì vậy trước khi tiến hành giao dịch cần phải xem xét mọi mặt vấn đề chấp nhận tiến hành giao dịch cụ thể xét theo quan điểm của nguồn lực tài chính sẵn có và mức độ am hiểu thị trường tài chính.
Sử dụng thông tin: sử dụng toàn bộ hay riêng biệt các dữ liệu trên trang web của công ty TeleTrade như một nguồn cung cấp thông tin nhất định. Việc sử dụng tư liệu từ trang web cần kèm theo liên kết đến trang teletrade.vn. Việc tự động thu thập số liệu cũng như thông tin từ trang web TeleTrade đều không được phép.
Xin vui lòng liên hệ với pr@teletrade.global nếu có câu hỏi.
ngân hàng