- Phân tích
- Tin tức và các công cụ
- Tin tức thị trường
- Gold Price Forecast: XAU/USD’s path of least resistance appears down, Fed in focus – Confluence Detector
Gold Price Forecast: XAU/USD’s path of least resistance appears down, Fed in focus – Confluence Detector
- Gold price rebound remains capped below the critical resistance.
- Fed decision to provide the next directional move in gold price.
- Gold at the mercy of the Fed, ascending triangle pattern in play.
Despite the record run in Wall Street indices and an uptick in the US Consumer Price Index (CPI) on Friday, gold price jumped last Friday. The jump in the US inflation was not as big as expected, which cooled off aggressive Fed rate hike bets, allowing gold price to stage a comeback amid a broad US dollar decline. Stepping into a big week, the Fed decision will provide the next big move in gold price, as it will throw fresh light on the world’s most central bank’s tightening plans. In the meantime, the Omicron covid variant-related updates and the Fed sentiment will keep gold traders on their toes.
Read: Attention shifts to the Fed as US CPI hits a 39-year high
Gold Price: Key levels to watch
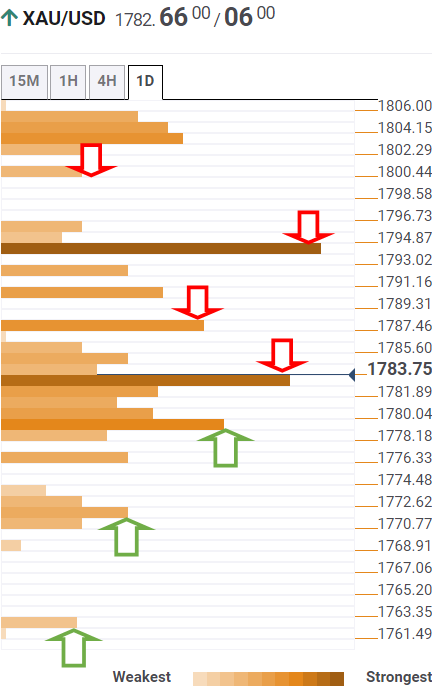
The Technical Confluences Detector shows that the gold price is looking to challenge support at $1,780, where the SMA10 one-day coincides with the Fibonacci 38.2% one-week and Fibonacci 61.8% one -day.
The next relevant cushion is envisioned at the Fibonacci 23.6% one week at $1,776. Further south, gold sellers will challenge a bunch of healthy support levels around $1,771, which is the confluence of the pivot point one-week S1, pivot point one-day R1 and Friday’s low.
A sustained move below the latter could trigger a drop towards $1,773-$1,772, the intersection of the Fibonacci 23.6% one-week, pivot point one-day S2 and the Fibonacci 161.8% one-day.
Sustained weakness below the latter will open up floors towards the pivot point one-day S2 at $1,762.
On the upside, gold bulls need to break above a dense cluster of significant resistance levels around $1,783. That price zone is the intersection of the Fibonacci 38.2% one-day, Fibonacci 61.8% one-week and SMA5 one-day.
Gold bulls will then aim for the Fibonacci 23.6% one-month at $1,787, above which powerful resistance awaits around $1,793.
At that point, the SMAs100 and 200 one-day converge with the previous week’s high. Immediate upside will then face a hurdle at the SMA50 one-day at $1,796.
Acceptance above that level will see a fresh advance towards the $1.800 psychological level.
Here is how it looks on the tool
About Technical Confluences Detector
The TCD (Technical Confluences Detector) is a tool to locate and point out those price levels where there is a congestion of indicators, moving averages, Fibonacci levels, Pivot Points, etc. If you are a short-term trader, you will find entry points for counter-trend strategies and hunt a few points at a time. If you are a medium-to-long-term trader, this tool will allow you to know in advance the price levels where a medium-to-long-term trend may stop and rest, where to unwind positions, or where to increase your position size.


© 2000-2026. Bản quyền Teletrade.
Trang web này được quản lý bởi Teletrade D.J. LLC 2351 LLC 2022 (Euro House, Richmond Hill Road, Kingstown, VC0100, St. Vincent and the Grenadines).
Thông tin trên trang web không phải là cơ sở để đưa ra quyết định đầu tư và chỉ được cung cấp cho mục đích làm quen.
Giao dịch trên thị trường tài chính (đặc biệt là giao dịch sử dụng các công cụ biên) mở ra những cơ hội lớn và tạo điều kiện cho các nhà đầu tư sẵn sàng mạo hiểm để thu lợi nhuận, tuy nhiên nó mang trong mình nguy cơ rủi ro khá cao. Chính vì vậy trước khi tiến hành giao dịch cần phải xem xét mọi mặt vấn đề chấp nhận tiến hành giao dịch cụ thể xét theo quan điểm của nguồn lực tài chính sẵn có và mức độ am hiểu thị trường tài chính.
Sử dụng thông tin: sử dụng toàn bộ hay riêng biệt các dữ liệu trên trang web của công ty TeleTrade như một nguồn cung cấp thông tin nhất định. Việc sử dụng tư liệu từ trang web cần kèm theo liên kết đến trang teletrade.vn. Việc tự động thu thập số liệu cũng như thông tin từ trang web TeleTrade đều không được phép.
Xin vui lòng liên hệ với pr@teletrade.global nếu có câu hỏi.
ngân hàng