- Phân tích
- Tin tức và các công cụ
- Tin tức thị trường
- Gold Price Forecast: $1,790 remains a tough nut to crack ahead of Fed – Confluence Detector
Gold Price Forecast: $1,790 remains a tough nut to crack ahead of Fed – Confluence Detector
- Gold price drops as the US dollar rises on a risk-off market profile.
- Wednesday’s Fed decision to provide the next decisive move in gold price.
- Gold at the mercy of the Fed, ascending triangle pattern in play.
Where is gold price headed? Markets are eagerly looking forward to the Fed decision, as the two-day FOMC meeting kicks off on Tuesday. Ahead of the Fed verdict, the Omicron covid variant fears have gripped the market, putting a fresh bid under the safe-haven US dollar at gold’s expense. Meanwhile, the Treasury yields hold steady on expectations of faster Fed’s tapering and hint at a mid-2022 rate hike.
Read: Gold Price Forecast: XAU/USD bull-bear tug-of-war likely to extend but upside risks likely
Gold Price: Key levels to watch
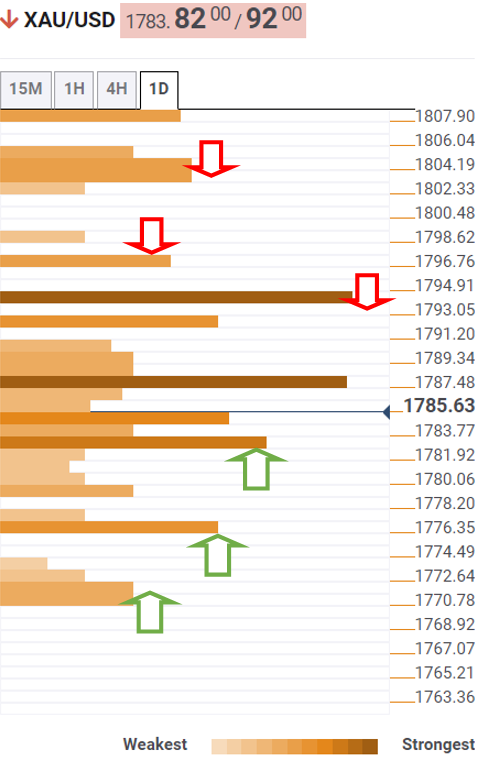
The Technical Confluences Detector shows that the gold price continues to run into strong offers at $1,790, which is the meeting point of the SMA100 one-day, Fibonacci 23.6% one-day and SMA100 four-hour.
A decisive break above the latter could unleash the additional recovery towards the next powerful resistance at $1,793. At that level, the SMA200 one-day coincides with the previous week’s high and pivot point one-week R1.
Gold bulls will then target $1,796, the confluence of the pivot point one-day R2 and SMA50 one-day.
A dense cluster of healthy resistance levels awaits at $1,804, the convergence of the Fibonacci 38.2% one-month, pivot point one-week R2 and pivot point one-day R3.
Alternatively, the selling momentum could accelerate below the pivot point one-day S1 at $1,781.
Gold bears will then challenge the downside target at $1,779, where the Fibonacci 38.2% one-week meets with the SMA10 one-day.
Further south, the intersection of the Fibonacci 161.8% and Fibonacci 23.6% one-week at $1,775.
The last line of defense for gold buyers is the previous week’s low of $1,770.
Here is how it looks on the tool
About Technical Confluences Detector
The TCD (Technical Confluences Detector) is a tool to locate and point out those price levels where there is a congestion of indicators, moving averages, Fibonacci levels, Pivot Points, etc. If you are a short-term trader, you will find entry points for counter-trend strategies and hunt a few points at a time. If you are a medium-to-long-term trader, this tool will allow you to know in advance the price levels where a medium-to-long-term trend may stop and rest, where to unwind positions, or where to increase your position size.


© 2000-2026. Bản quyền Teletrade.
Trang web này được quản lý bởi Teletrade D.J. LLC 2351 LLC 2022 (Euro House, Richmond Hill Road, Kingstown, VC0100, St. Vincent and the Grenadines).
Thông tin trên trang web không phải là cơ sở để đưa ra quyết định đầu tư và chỉ được cung cấp cho mục đích làm quen.
Giao dịch trên thị trường tài chính (đặc biệt là giao dịch sử dụng các công cụ biên) mở ra những cơ hội lớn và tạo điều kiện cho các nhà đầu tư sẵn sàng mạo hiểm để thu lợi nhuận, tuy nhiên nó mang trong mình nguy cơ rủi ro khá cao. Chính vì vậy trước khi tiến hành giao dịch cần phải xem xét mọi mặt vấn đề chấp nhận tiến hành giao dịch cụ thể xét theo quan điểm của nguồn lực tài chính sẵn có và mức độ am hiểu thị trường tài chính.
Sử dụng thông tin: sử dụng toàn bộ hay riêng biệt các dữ liệu trên trang web của công ty TeleTrade như một nguồn cung cấp thông tin nhất định. Việc sử dụng tư liệu từ trang web cần kèm theo liên kết đến trang teletrade.vn. Việc tự động thu thập số liệu cũng như thông tin từ trang web TeleTrade đều không được phép.
Xin vui lòng liên hệ với pr@teletrade.global nếu có câu hỏi.
ngân hàng