- Phân tích
- Tin tức và các công cụ
- Tin tức thị trường
- Gold Price Forecast: XAU/USD faces a wall of resistances around $1,812 – Confluence Detector
Gold Price Forecast: XAU/USD faces a wall of resistances around $1,812 – Confluence Detector
- Gold price is retreating from multi-day top but holds comfortably above $1,800.
- The US dollar rebound is weighing on gold but weaker yields could cap the losses.
- Gold awaits a sustained move above $1,815 amid favorable technicals.
Gold price extended the previous week’s upbeat momentum into a fresh on Monday, but bulls fail to sustain at higher levels amid a lack of fresh catalysts and thin liquidity. Gold price is easing from six-day highs, courtesy of the rebound in the US dollar across the board. However, weaker Treasury yields lend support to bulls, limiting the corrective decline in gold price. Looking ahead, gold price will remain at the mercy of year-end flows, dynamics in the dollar and the yields.
Read: Gold 2022 Outlook: Correlation with US T-bond yields to drive yellow metal
Gold Price: Key levels to watch
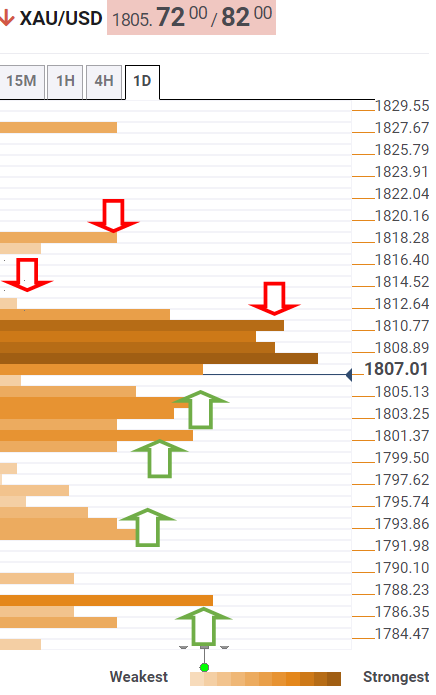
The Technical Confluences Detector shows that the gold price is turning south after facing a wall of resistances stacked up around $1,1812.
Around that price zone, the pivot point one-day R2, Fibonacci 161.8% one-day and the previous high four-hour coincide.
A sustained move above the latter is needed to take out the December month highs of $1,814.
Acceptance above the monthly peak will put the pivot point one-day R2 at $1,817 to test.
Alternatively, immediate support is aligned at $1,803, the confluence of the Fibonacci 38.2% one-month and SMA50 one-hour.
The next stop for gold sellers is seen at $1,800, the intersection of the SMA50 one-day, Fibonacci 38.2% one-week and SMA5 one-day.
If the selling pressure intensifies, then bears would target $1,792, the point of contact of the Fibonacci 61.8% one-week, SMA10 one-day and pivot point one-week S1.
The next line of defense for XAU bulls is seen at $1,789, where the SMA100 one-day appears.
Further down, the confluence of the Fibonacci 23.6% one-month and SMA100 four-hour at $1,787 will get tested.
Here is how it looks on the tool
About Technical Confluences Detector
The TCD (Technical Confluences Detector) is a tool to locate and point out those price levels where there is a congestion of indicators, moving averages, Fibonacci levels, Pivot Points, etc. If you are a short-term trader, you will find entry points for counter-trend strategies and hunt a few points at a time. If you are a medium-to-long-term trader, this tool will allow you to know in advance the price levels where a medium-to-long-term trend may stop and rest, where to unwind positions, or where to increase your position size.


© 2000-2026. Bản quyền Teletrade.
Trang web này được quản lý bởi Teletrade D.J. LLC 2351 LLC 2022 (Euro House, Richmond Hill Road, Kingstown, VC0100, St. Vincent and the Grenadines).
Thông tin trên trang web không phải là cơ sở để đưa ra quyết định đầu tư và chỉ được cung cấp cho mục đích làm quen.
Giao dịch trên thị trường tài chính (đặc biệt là giao dịch sử dụng các công cụ biên) mở ra những cơ hội lớn và tạo điều kiện cho các nhà đầu tư sẵn sàng mạo hiểm để thu lợi nhuận, tuy nhiên nó mang trong mình nguy cơ rủi ro khá cao. Chính vì vậy trước khi tiến hành giao dịch cần phải xem xét mọi mặt vấn đề chấp nhận tiến hành giao dịch cụ thể xét theo quan điểm của nguồn lực tài chính sẵn có và mức độ am hiểu thị trường tài chính.
Sử dụng thông tin: sử dụng toàn bộ hay riêng biệt các dữ liệu trên trang web của công ty TeleTrade như một nguồn cung cấp thông tin nhất định. Việc sử dụng tư liệu từ trang web cần kèm theo liên kết đến trang teletrade.vn. Việc tự động thu thập số liệu cũng như thông tin từ trang web TeleTrade đều không được phép.
Xin vui lòng liên hệ với pr@teletrade.global nếu có câu hỏi.
ngân hàng