- Phân tích
- Tin tức và các công cụ
- Tin tức thị trường
- Gold Price Forecast: XAU/USD key levels to watch heading into 2022 – Confluence Detector
Gold Price Forecast: XAU/USD key levels to watch heading into 2022 – Confluence Detector
- Gold price remains depressed in a familiar range around the $1,800 mark.
- 10-year US Treasury yields are back above 1.50%, pressurizing gold price.
- Gold 2022 Outlook: Correlation with US T-bond yields to drive yellow metal.
Amid thin-year end liquidity conditions, gold price continues to trade choppy within familiar levels, largely pivoting around the $1,800 mark. The downbeat sentiment around gold price could be attributed to a broad-based US dollar rebound, aided by the recent strength in the Treasury yields. The 10-year rates have recaptured the 1.50% key level, which warrants caution for gold bulls. Going forward the year-end repositioning in the greenback will continue to have a significant impact on gold while thin conditions could exaggerate the moves.
Read: Gold Price Forecast: Year-end flows to keep XAU/USD choppy around $1,800
Gold Price: Key levels to watch
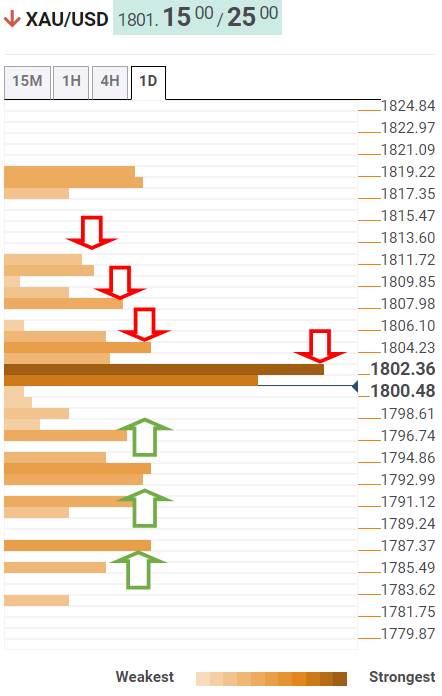
The Technical Confluences Detector shows that the gold price is struggling to recapture strong resistance at $1,803, which is the intersection of the Fibonacci 38.2% one-week, Fibonacci 61.8% one-day and SMA10 one-day.
The immediate upside will then be capped by the Fibonacci 38.2% one-month of $1,806. The previous day’s high of $1,808 will provide another roadblock to gold buyers.
Acceptance above the latter could fuel a renewed uptick towards the previous week’s high of $1,811, above which the December top of $1,820 will be on the bulls’ radars.
On the flip side, the Fibonacci 38.2% one-day at $1,796 will get tested on a sustained move below $1,800.
A dense cluster of healthy support levels is aligned around $1,793, which will be a powerful cap. That price zone comprises of the SMA100 four-hour, Fibonacci 23.6% one-day and pivot point one-week S1.
SMA100 one-day at $1,791 will be the next downside target, below which sellers will aim for the Fibonacci 23.6% one-month at $1,787.
Here is how it looks on the tool
About Technical Confluences Detector
The TCD (Technical Confluences Detector) is a tool to locate and point out those price levels where there is a congestion of indicators, moving averages, Fibonacci levels, Pivot Points, etc. If you are a short-term trader, you will find entry points for counter-trend strategies and hunt a few points at a time. If you are a medium-to-long-term trader, this tool will allow you to know in advance the price levels where a medium-to-long-term trend may stop and rest, where to unwind positions, or where to increase your position size.


© 2000-2026. Bản quyền Teletrade.
Trang web này được quản lý bởi Teletrade D.J. LLC 2351 LLC 2022 (Euro House, Richmond Hill Road, Kingstown, VC0100, St. Vincent and the Grenadines).
Thông tin trên trang web không phải là cơ sở để đưa ra quyết định đầu tư và chỉ được cung cấp cho mục đích làm quen.
Giao dịch trên thị trường tài chính (đặc biệt là giao dịch sử dụng các công cụ biên) mở ra những cơ hội lớn và tạo điều kiện cho các nhà đầu tư sẵn sàng mạo hiểm để thu lợi nhuận, tuy nhiên nó mang trong mình nguy cơ rủi ro khá cao. Chính vì vậy trước khi tiến hành giao dịch cần phải xem xét mọi mặt vấn đề chấp nhận tiến hành giao dịch cụ thể xét theo quan điểm của nguồn lực tài chính sẵn có và mức độ am hiểu thị trường tài chính.
Sử dụng thông tin: sử dụng toàn bộ hay riêng biệt các dữ liệu trên trang web của công ty TeleTrade như một nguồn cung cấp thông tin nhất định. Việc sử dụng tư liệu từ trang web cần kèm theo liên kết đến trang teletrade.vn. Việc tự động thu thập số liệu cũng như thông tin từ trang web TeleTrade đều không được phép.
Xin vui lòng liên hệ với pr@teletrade.global nếu có câu hỏi.
ngân hàng