- Phân tích
- Tin tức và các công cụ
- Tin tức thị trường
- USD/CAD Price Analysis: The bearish playbook is unfolding, daily M-formaiton in focus
USD/CAD Price Analysis: The bearish playbook is unfolding, daily M-formaiton in focus
- USD/CAD is carving out a bearish structure on the daily chart.
- Some consolidation would be expected prior to the next downside move with 1.2600 eyed.
As per the start of the week's analysis, The Chart of the Week: USD/CAD has complied with the medium-term bearish bias, the price is adhering to the market's structure and the following illustrates sth bearish perspective:
USD/CAD daily chart, prior analysis
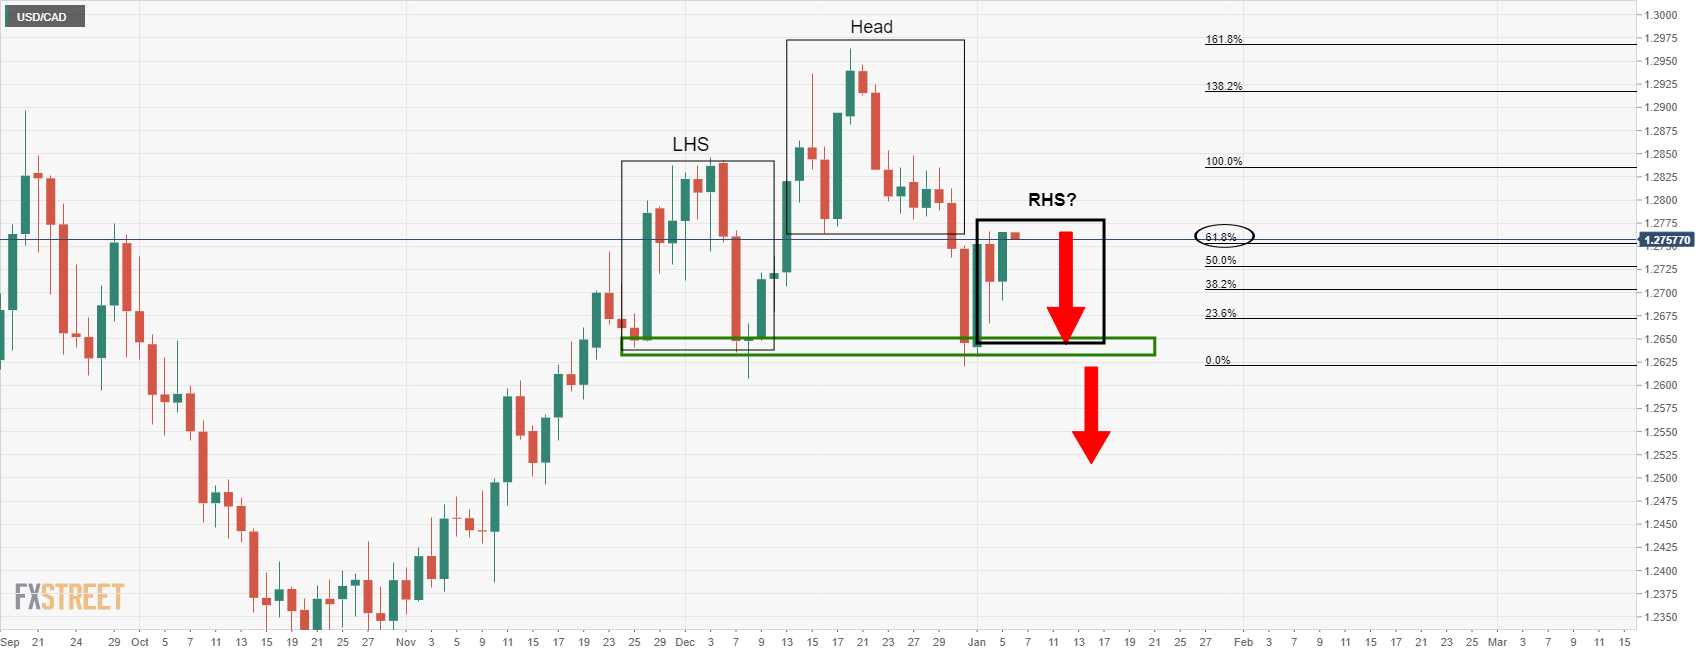
As illustrated above, the head and shoulders were in the making...
USD/CAD daily chart analysis
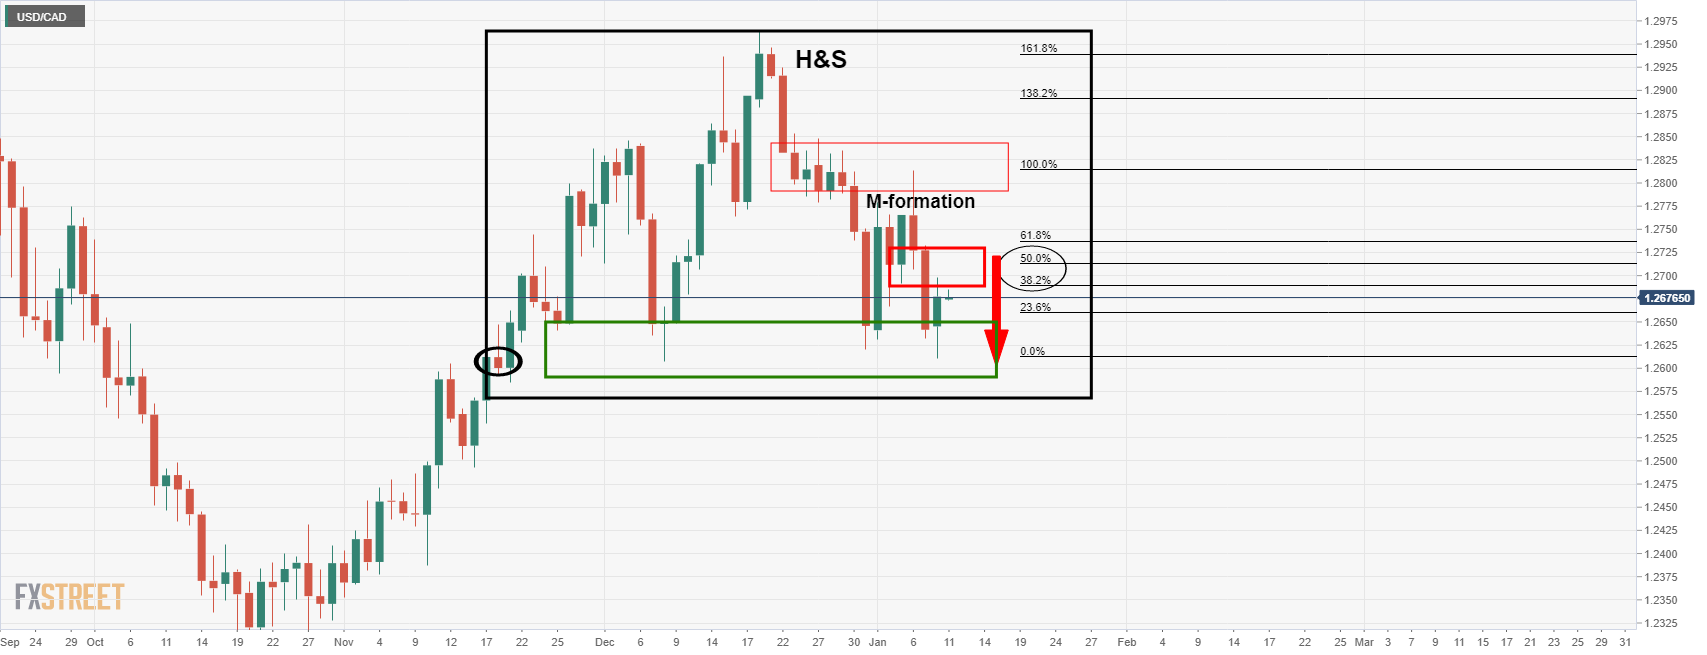
The price is now leaving an M-formation on the chart as illustrated above and is drawing the bulls into the neckline.
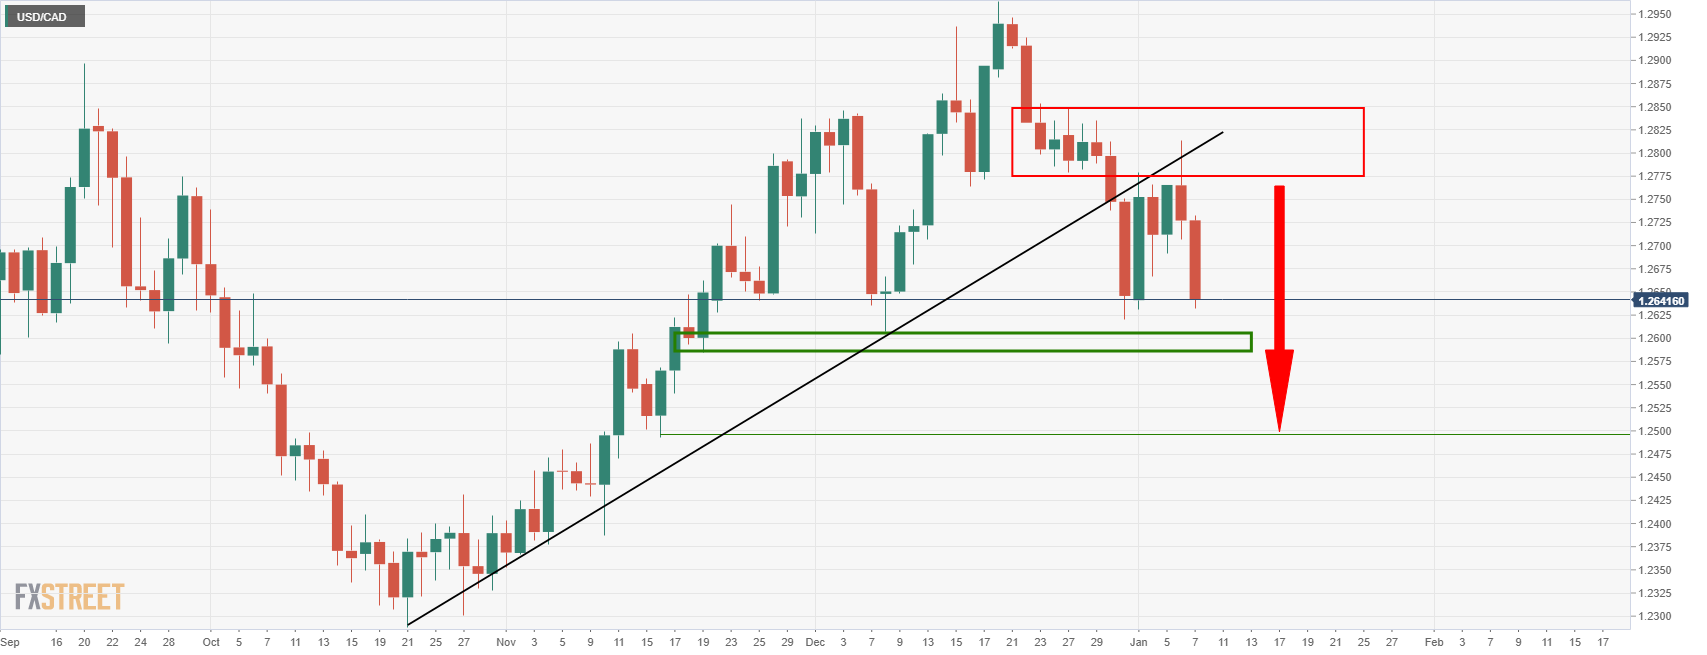
This can be seen on the 4-hour time frame as in the following prior analysis:
As see, the prior analysis at the start of the week forecasted a move into the 1.27 area and it has played out as follows:
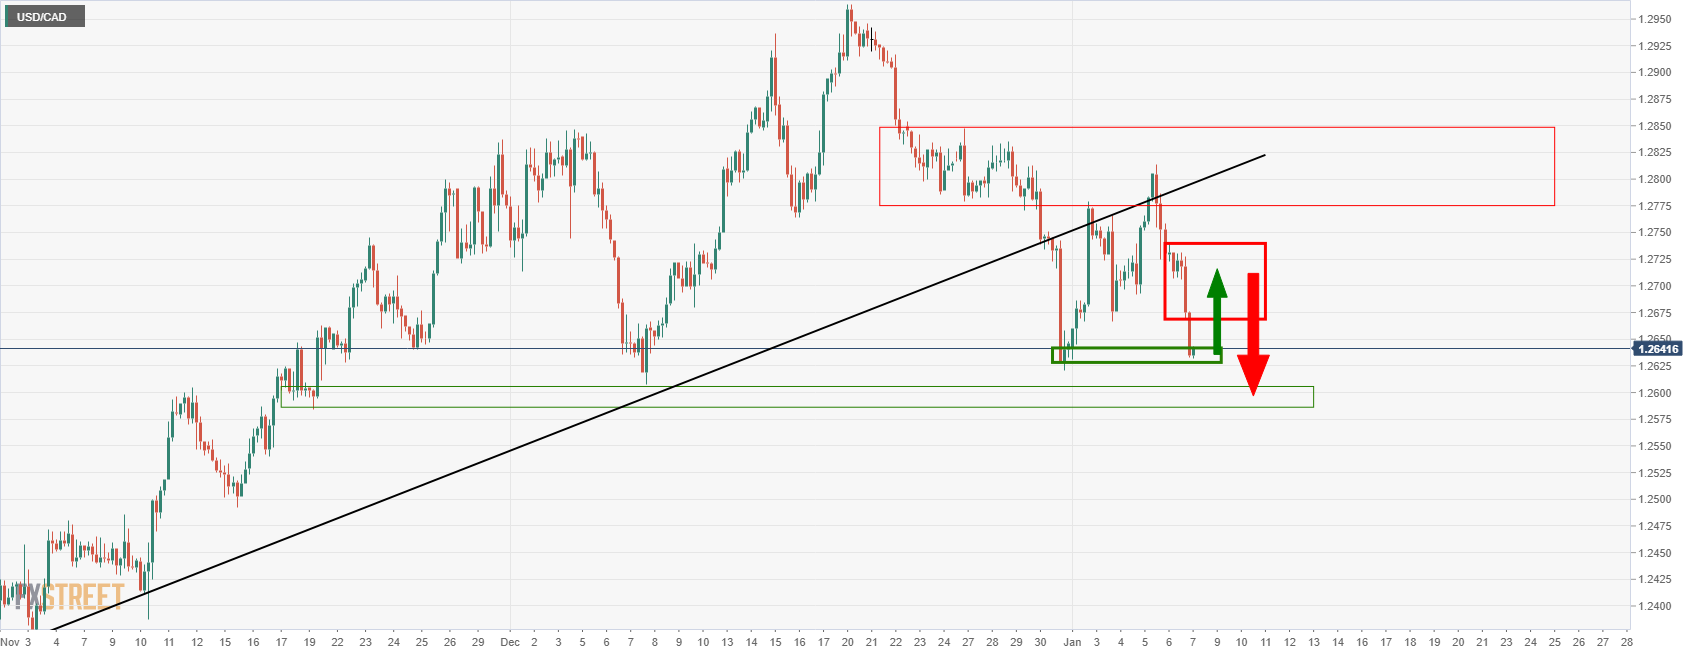
USD/CAD H4 chart
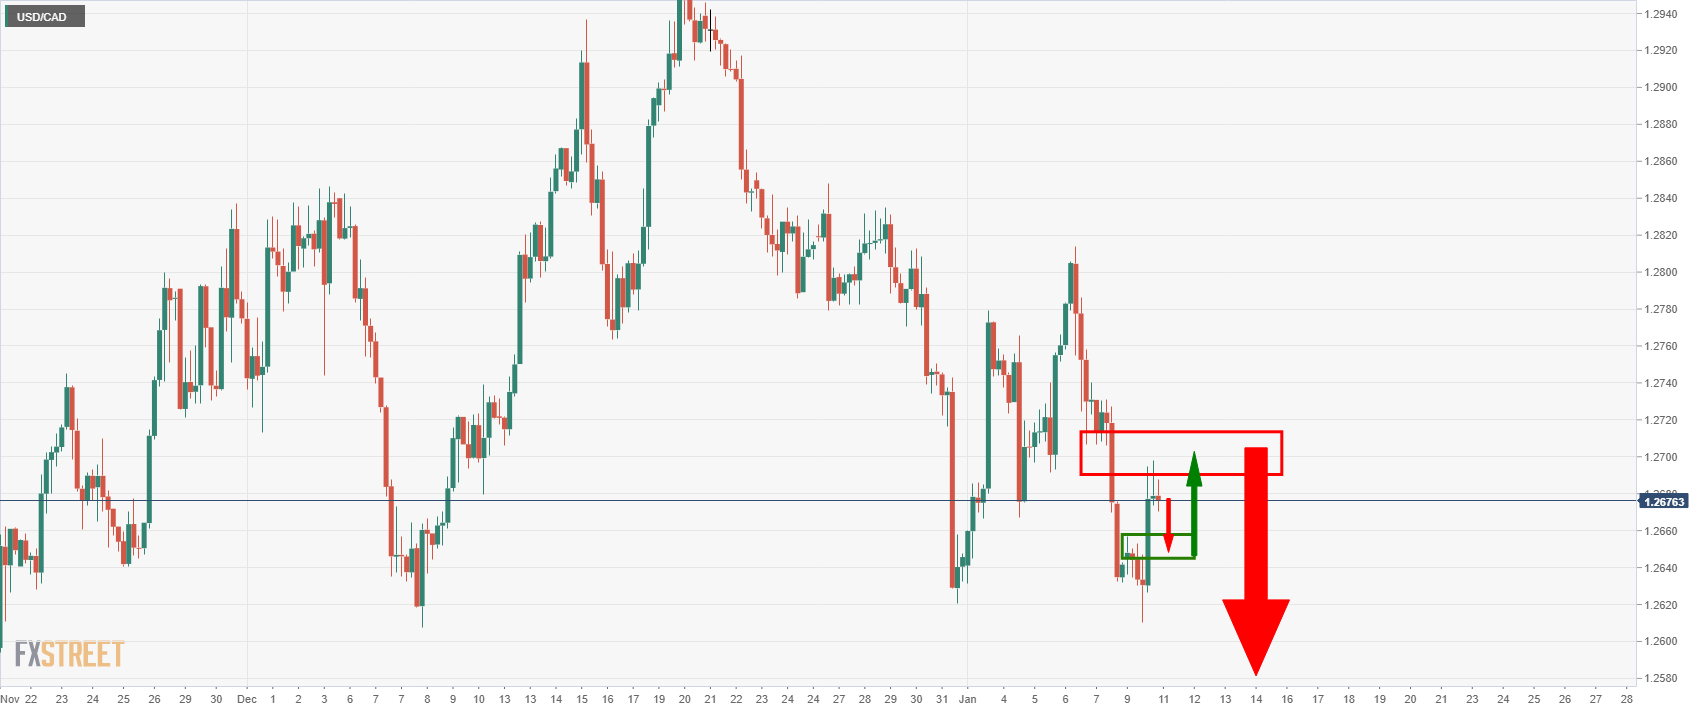
We can now expect the price to mitigate the imbalance to a restest of what would be expected to act as support on first attempts near 1.2650. This could lead to a deeper bullish correction into the daily M-formation's neckline near 1.2700/10 again prior to a full-on downside break to test 1.26 the figure.


© 2000-2026. Bản quyền Teletrade.
Trang web này được quản lý bởi Teletrade D.J. LLC 2351 LLC 2022 (Euro House, Richmond Hill Road, Kingstown, VC0100, St. Vincent and the Grenadines).
Thông tin trên trang web không phải là cơ sở để đưa ra quyết định đầu tư và chỉ được cung cấp cho mục đích làm quen.
Giao dịch trên thị trường tài chính (đặc biệt là giao dịch sử dụng các công cụ biên) mở ra những cơ hội lớn và tạo điều kiện cho các nhà đầu tư sẵn sàng mạo hiểm để thu lợi nhuận, tuy nhiên nó mang trong mình nguy cơ rủi ro khá cao. Chính vì vậy trước khi tiến hành giao dịch cần phải xem xét mọi mặt vấn đề chấp nhận tiến hành giao dịch cụ thể xét theo quan điểm của nguồn lực tài chính sẵn có và mức độ am hiểu thị trường tài chính.
Sử dụng thông tin: sử dụng toàn bộ hay riêng biệt các dữ liệu trên trang web của công ty TeleTrade như một nguồn cung cấp thông tin nhất định. Việc sử dụng tư liệu từ trang web cần kèm theo liên kết đến trang teletrade.vn. Việc tự động thu thập số liệu cũng như thông tin từ trang web TeleTrade đều không được phép.
Xin vui lòng liên hệ với pr@teletrade.global nếu có câu hỏi.
ngân hàng