- Phân tích
- Tin tức và các công cụ
- Tin tức thị trường
- Gold Price Forecast: XAU/USD sees a dead cat bounce towards $1,822 – Confluence Detector
Gold Price Forecast: XAU/USD sees a dead cat bounce towards $1,822 – Confluence Detector
- Gold price remains pressured amid firmer US dollar and Treasury yields.
- Fed almost confirms a March rate hike, also balance-sheet reduction this year.
- Gold Price Forecast: XAU/USD bears await US Q4 GDP for the next leg lower
Gold price is pressured by the hawkish Fed’s rhetoric-driven sell-off, as Jerome Powell and Company explicitly said there is room for interest rate hikes while adding that the plans for the balance-sheet reduction are in the offing. The US Treasury yields continue taking advantage of the Fed’s hawkishness, underpinning the dollar bulls at gold’s expense. Further, expectations of aggressive Fed tightening killed the appetite for riskier assets such as stocks and boosted the greenback’s safe-haven demand, exerting additional bearish pressure on gold price. The focus now shifts towards the US top-tier economic releases for fresh trading opportunities in gold.
Read: Fed fallout set to run further
Gold Price: Key levels to watch
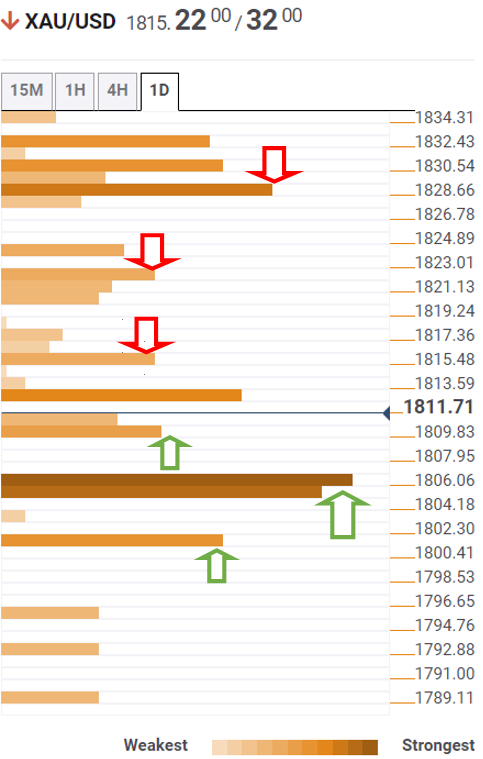
The Technical Confluences Detector shows that the gold price is attempting a bounce after having found support at the convergence of the SMA200 four-hour and pivot point one-week S1 at $1,809.
In doing so, the bright metal has cleared the Fibonacci 23.6% one-month at $1,813 to take on the previous day’s low of $1,815.
Acceptance above the latter will call for a fresh rally towards $1,822, the meeting point of the Fibonacci 61.8% one-week and SMA100 four-hour.
Further up, the Fibonacci 38.2% one-day at $1,828 will guard the bullish attempts.
On the flip side, if the abovementioned $1,809 support is breached on a sustained basis, then sellers will look to test a powerful cushion around $1,805.
That level is the confluence of the previous week’s low, SMA200 one-day and SMA50 one-day.
The last line of defense for gold buyers is seen at the Fibonacci 38.2% one-month at $1,800.
Here is how it looks on the tool
About Technical Confluences Detector
The TCD (Technical Confluences Detector) is a tool to locate and point out those price levels where there is a congestion of indicators, moving averages, Fibonacci levels, Pivot Points, etc. If you are a short-term trader, you will find entry points for counter-trend strategies and hunt a few points at a time. If you are a medium-to-long-term trader, this tool will allow you to know in advance the price levels where a medium-to-long-term trend may stop and rest, where to unwind positions, or where to increase your position size.


© 2000-2026. Bản quyền Teletrade.
Trang web này được quản lý bởi Teletrade D.J. LLC 2351 LLC 2022 (Euro House, Richmond Hill Road, Kingstown, VC0100, St. Vincent and the Grenadines).
Thông tin trên trang web không phải là cơ sở để đưa ra quyết định đầu tư và chỉ được cung cấp cho mục đích làm quen.
Giao dịch trên thị trường tài chính (đặc biệt là giao dịch sử dụng các công cụ biên) mở ra những cơ hội lớn và tạo điều kiện cho các nhà đầu tư sẵn sàng mạo hiểm để thu lợi nhuận, tuy nhiên nó mang trong mình nguy cơ rủi ro khá cao. Chính vì vậy trước khi tiến hành giao dịch cần phải xem xét mọi mặt vấn đề chấp nhận tiến hành giao dịch cụ thể xét theo quan điểm của nguồn lực tài chính sẵn có và mức độ am hiểu thị trường tài chính.
Sử dụng thông tin: sử dụng toàn bộ hay riêng biệt các dữ liệu trên trang web của công ty TeleTrade như một nguồn cung cấp thông tin nhất định. Việc sử dụng tư liệu từ trang web cần kèm theo liên kết đến trang teletrade.vn. Việc tự động thu thập số liệu cũng như thông tin từ trang web TeleTrade đều không được phép.
Xin vui lòng liên hệ với pr@teletrade.global nếu có câu hỏi.
ngân hàng