- Phân tích
- Tin tức và các công cụ
- Tin tức thị trường
- Gold Price Forecast: XAU/USD pulls back before targeting $1,826 and $1,830 – Confluence Detector
Gold Price Forecast: XAU/USD pulls back before targeting $1,826 and $1,830 – Confluence Detector
- Gold price retreats from weekly highs as firmer Treasury yields lift the USD.
- Hawkish Fed expectations limit gold’s upside despite inflation worries.
- Gold bulls have the upper hand, $1,810 confluence holds the key.
Gold price is on the back foot on Tuesday after witnessing back-to-back rallies following the stunning US employment data. The renewed uptick in the US Treasury yields is boosting the demand for the greenback across the board, weighing on the non-yielding gold. Although looming US-Russian tensions over Ukraine and Sino-American tensions could help put a floor under the bright metal. Looking ahead, attention remains on the US inflation data due for release later this week for fresh insights on Fed’s tightening plans.
Read: Gold back to inflection point
Gold Price: Key levels to watch
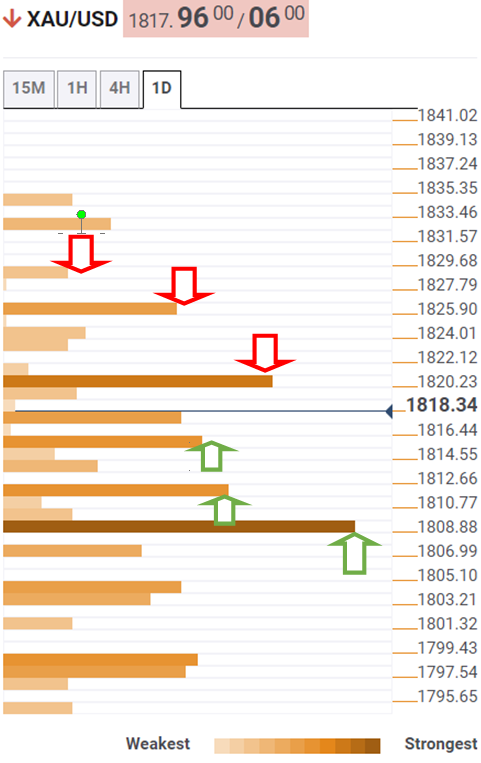
The Technical Confluences Detector shows that the gold price retracement is challenging the critical support area near $1,818, where the Fibonacci 38.2% one-day converges with the SMA100 four-hour.
If that support is breached then sellers will aim for the previous week’s high at $1,815.
The pivot point one-day S1 at $1,811 will come to the rescue of bulls should the pullback extend in gold price.
The last resort for buyers is seen at $1,809, strong support comprising of the Fibonacci 23.6% one-week, Fibonacci 38.2% one-month and SMA5 one-day.
On the flip side, immediate upside needs validation above the confluence of the pivot point one-week R1 and Fibonacci 23.6% one-day at $1,821.
The next critical resistance is placed at the weekly highs of $1,824, above which the Fibonacci 61.8% one-month at $1,826 could be tested.
A fresh upswing will kick in above the latter, opening doors towards $1,830 – pivot point one-day R1.
Here is how it looks on the tool
About Technical Confluences Detector
The TCD (Technical Confluences Detector) is a tool to locate and point out those price levels where there is a congestion of indicators, moving averages, Fibonacci levels, Pivot Points, etc. If you are a short-term trader, you will find entry points for counter-trend strategies and hunt a few points at a time. If you are a medium-to-long-term trader, this tool will allow you to know in advance the price levels where a medium-to-long-term trend may stop and rest, where to unwind positions, or where to increase your position size.


© 2000-2026. Bản quyền Teletrade.
Trang web này được quản lý bởi Teletrade D.J. LLC 2351 LLC 2022 (Euro House, Richmond Hill Road, Kingstown, VC0100, St. Vincent and the Grenadines).
Thông tin trên trang web không phải là cơ sở để đưa ra quyết định đầu tư và chỉ được cung cấp cho mục đích làm quen.
Giao dịch trên thị trường tài chính (đặc biệt là giao dịch sử dụng các công cụ biên) mở ra những cơ hội lớn và tạo điều kiện cho các nhà đầu tư sẵn sàng mạo hiểm để thu lợi nhuận, tuy nhiên nó mang trong mình nguy cơ rủi ro khá cao. Chính vì vậy trước khi tiến hành giao dịch cần phải xem xét mọi mặt vấn đề chấp nhận tiến hành giao dịch cụ thể xét theo quan điểm của nguồn lực tài chính sẵn có và mức độ am hiểu thị trường tài chính.
Sử dụng thông tin: sử dụng toàn bộ hay riêng biệt các dữ liệu trên trang web của công ty TeleTrade như một nguồn cung cấp thông tin nhất định. Việc sử dụng tư liệu từ trang web cần kèm theo liên kết đến trang teletrade.vn. Việc tự động thu thập số liệu cũng như thông tin từ trang web TeleTrade đều không được phép.
Xin vui lòng liên hệ với pr@teletrade.global nếu có câu hỏi.
ngân hàng