- Phân tích
- Tin tức và các công cụ
- Tin tức thị trường
- Gold Price Forecast: XAU/USD’s downside appears capped near $1,845 ahead of Fed minutes – Confluence Detector
Gold Price Forecast: XAU/USD’s downside appears capped near $1,845 ahead of Fed minutes – Confluence Detector
- Gold price remains at the mercy of the geopolitical woes, Fed’s sentiment.
- The January FOMC minutes could playdown the hawkish prospects.
- US January Retail Sales Preview: Geopolitics, FOMC Minutes to impact dollar’s valuation.
The week so far has been quite overwhelming for gold price, with more action foreseen on the critical event risks from the US. The Fed minutes and the US Retail Sales will grab the market’s attention away from the ongoing theme around the Russia-Ukraine geopolitical tensions. Although, the risks around the Ukrainian border persist and will continue to lead the sentiment alongside the Fed’s hawkish outlook in the upcoming sessions.
Read: FOMC Minutes Preview: Dollar selling opportunity? Doves set for a comeback after hawkish meeting
Gold Price: Key levels to watch
As well predicted, gold price did test the $1,878 resistance zone before plummeting on a sudden turnaround in the market sentiment.
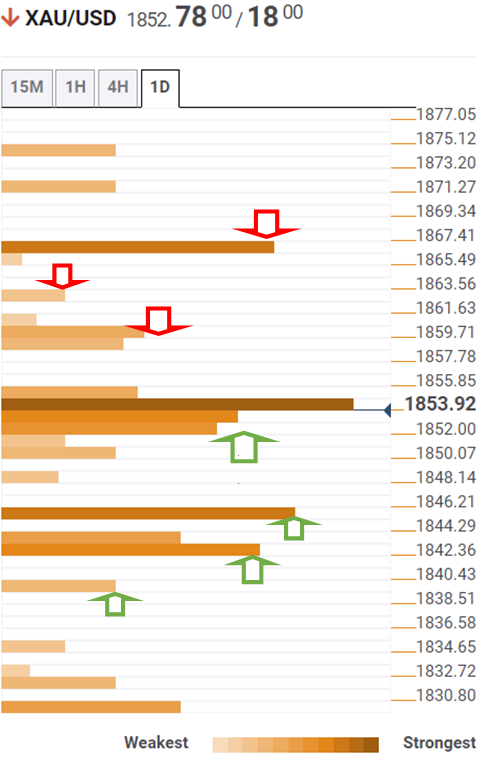
Looking ahead, the Technical Confluences Detector shows that the downside in the gold price has been capped around the $1,852-$1,850 region so far, which is the convergence of the previous month’s high, Fibonacci 23.6% one-day and one-week.
A firm break below the latter will fuel a fresh decline towards the previous day’s low of $1,845.
Further south, the intersection of the pivot point one-month R1 and Fibonacci 38.2% one-week at $1,843 will come to the rescue of gold bulls.
The pivot point one-day S1 at $1,838 will emerge as the last line of defense should the corrective downside extend.
On the flip side, gold price needs to find acceptance above $1,859, where the Fibonacci 38.2% one-day coincides with the Bollinger Band one-hour Upper.
The next bullish target is seen at the SMA10 four-hour of $1,862, above which powerful resistance at $1,866 will get retested.
At the point, the Fibonacci 61.8% one-day and the previous week’s high connect.
Here is how it looks on the tool
About Technical Confluences Detector
The TCD (Technical Confluences Detector) is a tool to locate and point out those price levels where there is a congestion of indicators, moving averages, Fibonacci levels, Pivot Points, etc. If you are a short-term trader, you will find entry points for counter-trend strategies and hunt a few points at a time. If you are a medium-to-long-term trader, this tool will allow you to know in advance the price levels where a medium-to-long-term trend may stop and rest, where to unwind positions, or where to increase your position size.


© 2000-2026. Bản quyền Teletrade.
Trang web này được quản lý bởi Teletrade D.J. LLC 2351 LLC 2022 (Euro House, Richmond Hill Road, Kingstown, VC0100, St. Vincent and the Grenadines).
Thông tin trên trang web không phải là cơ sở để đưa ra quyết định đầu tư và chỉ được cung cấp cho mục đích làm quen.
Giao dịch trên thị trường tài chính (đặc biệt là giao dịch sử dụng các công cụ biên) mở ra những cơ hội lớn và tạo điều kiện cho các nhà đầu tư sẵn sàng mạo hiểm để thu lợi nhuận, tuy nhiên nó mang trong mình nguy cơ rủi ro khá cao. Chính vì vậy trước khi tiến hành giao dịch cần phải xem xét mọi mặt vấn đề chấp nhận tiến hành giao dịch cụ thể xét theo quan điểm của nguồn lực tài chính sẵn có và mức độ am hiểu thị trường tài chính.
Sử dụng thông tin: sử dụng toàn bộ hay riêng biệt các dữ liệu trên trang web của công ty TeleTrade như một nguồn cung cấp thông tin nhất định. Việc sử dụng tư liệu từ trang web cần kèm theo liên kết đến trang teletrade.vn. Việc tự động thu thập số liệu cũng như thông tin từ trang web TeleTrade đều không được phép.
Xin vui lòng liên hệ với pr@teletrade.global nếu có câu hỏi.
ngân hàng