- Phân tích
- Tin tức và các công cụ
- Tin tức thị trường
- Gold Price Forecast: Acceptance above $2,000 to open doors towards $2,022 – Confluence Detector
Gold Price Forecast: Acceptance above $2,000 to open doors towards $2,022 – Confluence Detector
- Gold price rallies as the Russia-Ukraine crisis gets entrenched, triggers oil shock.
- Gold bulls are gearing up to regain the upside towards $2,020 and beyond.
- Gold price risks a correction before next upswing kicks in above $2,000.
A new week begins but nothing changes on the geopolitical front, as Russia’s resolve to invade Ukraine gets firmer while the US looks to isolate Russia completely by banning oil imports. As the Ukrainian crisis deepens, the market sentiment remains roiled, facing a double whammy from soaring oil prices. Investors take shelter in the traditional safe-haven gold, in the face of raging energy inflation and its impact on global economic growth. All eyes remain on geopolitics and oil prices for fresh trading opportunities in gold price.
Read: US weighs acting without allies on ban of Russian oil imports
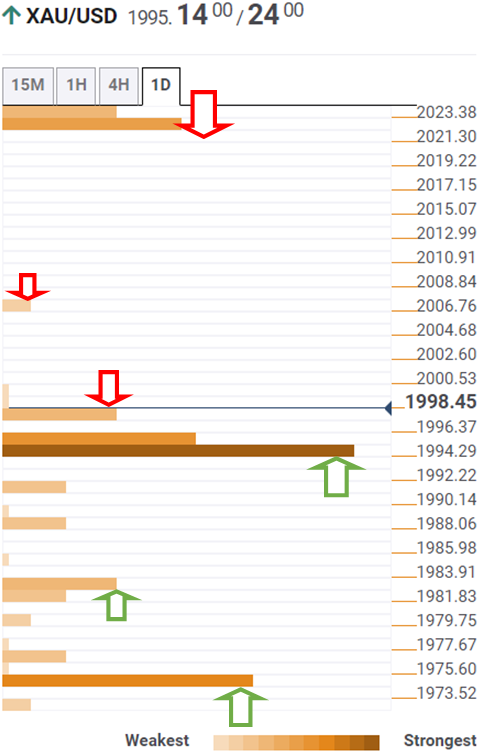
Gold Price: Key levels to watch
The Technical Confluences Detector shows that gold price has recovered ground once again above $1,995 strong resistance, where the pivot point one-month R1, pivot point one-week R1 and the previous high four-hour.
The pivot point one-day R2 at $1,998 will guard the immediate upside, above which buyers will retest the multi-month highs at $2,001.
On buying resurgence, gold price could advance towards the Bollinger Band one-hour Upper at $2,007 before resuming storming towards $2,022.
That level is the confluence of the pivot point one-week R2 and pivot point one-day R3.
The next resistance is aligned at the pivot point one-day R3 at $1,964. Should buyers regain a strong foothold above the latter, then a rally for a retest of 13-month highs of $1,975 cannot be ruled out.
Gold bulls will then gear up for a fresh upswing to conquer the $2,000 mark.
On the flip side, fierce support is seen at $1,982, where the pivot point one-day R1 coincides with the SMA5 four-hour.
The previous month’s high of $1,975 will be tested once again if the correction picks up pace. The last line of defense for gold bulls is the daily lows of $1,972.
Here is how it looks on the tool
About Technical Confluences Detector
The TCD (Technical Confluences Detector) is a tool to locate and point out those price levels where there is a congestion of indicators, moving averages, Fibonacci levels, Pivot Points, etc. If you are a short-term trader, you will find entry points for counter-trend strategies and hunt a few points at a time. If you are a medium-to-long-term trader, this tool will allow you to know in advance the price levels where a medium-to-long-term trend may stop and rest, where to unwind positions, or where to increase your position size.


© 2000-2026. Bản quyền Teletrade.
Trang web này được quản lý bởi Teletrade D.J. LLC 2351 LLC 2022 (Euro House, Richmond Hill Road, Kingstown, VC0100, St. Vincent and the Grenadines).
Thông tin trên trang web không phải là cơ sở để đưa ra quyết định đầu tư và chỉ được cung cấp cho mục đích làm quen.
Giao dịch trên thị trường tài chính (đặc biệt là giao dịch sử dụng các công cụ biên) mở ra những cơ hội lớn và tạo điều kiện cho các nhà đầu tư sẵn sàng mạo hiểm để thu lợi nhuận, tuy nhiên nó mang trong mình nguy cơ rủi ro khá cao. Chính vì vậy trước khi tiến hành giao dịch cần phải xem xét mọi mặt vấn đề chấp nhận tiến hành giao dịch cụ thể xét theo quan điểm của nguồn lực tài chính sẵn có và mức độ am hiểu thị trường tài chính.
Sử dụng thông tin: sử dụng toàn bộ hay riêng biệt các dữ liệu trên trang web của công ty TeleTrade như một nguồn cung cấp thông tin nhất định. Việc sử dụng tư liệu từ trang web cần kèm theo liên kết đến trang teletrade.vn. Việc tự động thu thập số liệu cũng như thông tin từ trang web TeleTrade đều không được phép.
Xin vui lòng liên hệ với pr@teletrade.global nếu có câu hỏi.
ngân hàng