- Phân tích
- Tin tức và các công cụ
- Tin tức thị trường
- Gold Price Forecast: XAU/USD keeps March lows of $1,902 and the Fed in focus – Confluence Detector
Gold Price Forecast: XAU/USD keeps March lows of $1,902 and the Fed in focus – Confluence Detector
- The pullback in US Treasury yields seems to offer a brief reprieve to gold bulls.
- The US dollar drops with yields but the Ukraine uncertainty to keep downside limited.
- Gold Price eyes monthly lows near $1,900, as focus shifts to Fed.
Gold price remains vulnerable despite a brief pause in its three-day downtrend amid a sharp pullback in the US Treasury yields, which has dragged the dollar lower alongside. The price action in the dollar and yields is a pre-Fed repositioning by the market participants, as they brace for the critical interest rate decision due to be announced on Wednesday. On the geopolitical front, hopes for diplomacy between Russia and Ukraine are also adding to the greenback’s bearish reversal while sending commodities, including gold and oil prices, into a tailspin.
Read: Russia-Ukraine: Five scenarios for the war and implications for stocks, the dollar, gold and oil
Gold Price: Key levels to watch
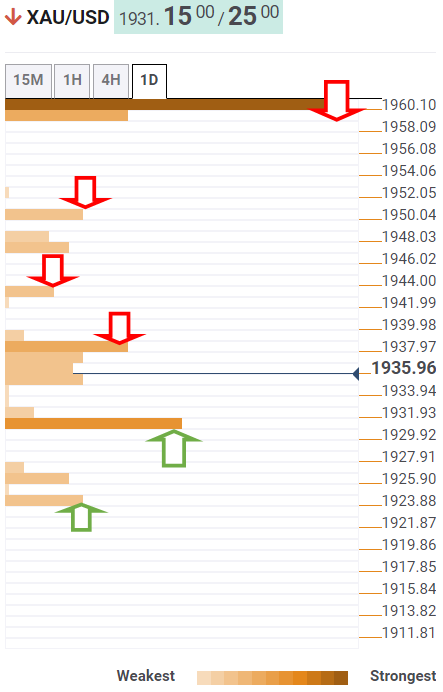
The Technical Confluences Detector shows that gold price is trimming losses, at the moment, which could turn out to be a good selling opportunity for traders who felt left out earlier this week.
The immediate support is envisioned at the Fibonacci 23.6% one-month at $1,930, below which the $1,942 area could be probed.
That demand zone is the confluence of the previous low four-hour and the pivot point one-day S2.
A sustained move below the latter will trigger a fresh downswing towards the March lows of $1,902.
On the other side, the recovery could find an initial upside hurdle around $1,936, which is the convergence of the pivot point one-week S1, pivot point one-day S1 and the Bollinger Band one-day Middle.
Acceptance above the latter is needed to retest the previous high four-hour at $1,942. Fresh buying opportunities could be created above the latter, opening doors towards the $1,955 – the intraday highs.
The next critical resistance level is seen at around $1,960, where the previous year’s high, the previous week’s low and the Fibonacci 23.6% one-day coincide.
Here is how it looks on the tool
About Technical Confluences Detector
The TCD (Technical Confluences Detector) is a tool to locate and point out those price levels where there is a congestion of indicators, moving averages, Fibonacci levels, Pivot Points, etc. If you are a short-term trader, you will find entry points for counter-trend strategies and hunt a few points at a time. If you are a medium-to-long-term trader, this tool will allow you to know in advance the price levels where a medium-to-long-term trend may stop and rest, where to unwind positions, or where to increase your position size.


© 2000-2026. Bản quyền Teletrade.
Trang web này được quản lý bởi Teletrade D.J. LLC 2351 LLC 2022 (Euro House, Richmond Hill Road, Kingstown, VC0100, St. Vincent and the Grenadines).
Thông tin trên trang web không phải là cơ sở để đưa ra quyết định đầu tư và chỉ được cung cấp cho mục đích làm quen.
Giao dịch trên thị trường tài chính (đặc biệt là giao dịch sử dụng các công cụ biên) mở ra những cơ hội lớn và tạo điều kiện cho các nhà đầu tư sẵn sàng mạo hiểm để thu lợi nhuận, tuy nhiên nó mang trong mình nguy cơ rủi ro khá cao. Chính vì vậy trước khi tiến hành giao dịch cần phải xem xét mọi mặt vấn đề chấp nhận tiến hành giao dịch cụ thể xét theo quan điểm của nguồn lực tài chính sẵn có và mức độ am hiểu thị trường tài chính.
Sử dụng thông tin: sử dụng toàn bộ hay riêng biệt các dữ liệu trên trang web của công ty TeleTrade như một nguồn cung cấp thông tin nhất định. Việc sử dụng tư liệu từ trang web cần kèm theo liên kết đến trang teletrade.vn. Việc tự động thu thập số liệu cũng như thông tin từ trang web TeleTrade đều không được phép.
Xin vui lòng liên hệ với pr@teletrade.global nếu có câu hỏi.
ngân hàng