- Phân tích
- Tin tức và các công cụ
- Tin tức thị trường
- Gold Price Forecast: XAU/USD looks vulnerable whilst below $1,941 – Confluence Detector
Gold Price Forecast: XAU/USD looks vulnerable whilst below $1,941 – Confluence Detector
- Gold price remains stuck in a familiar range below $1,940, lacking a clear direction.
- Treasury yields firm up on hawkish Fed while the Russia-Ukraine crisis rages on.
- Gold bulls to face an uphill battle amid hawkish Fed, Ukraine saga.
Amidst the hawkish Fed’s outlook and the Russia-Ukraine stand-off, gold price is struggling to find a clear direction. The bright metal continues to gyrate in a $20 narrow range so far this week, looking for a decisive break in either direction. Fed Chair Jerome Powell remains confident on the US economy, backing a 50bps rate hike in May. The aggressive Fed’s tightening plans have pushed the US Treasury yields through the roof, capping gold’s upside. Meanwhile, increased Russian hostilities on Ukraine and a stalemate on the peace talks keep the downside cushioned in gold price.
Read: Gold Price Forecast: XAU/USD to offset Fed rate hikes by virtue of safe-haven demand – ANZ
Gold Price: Key levels to watch
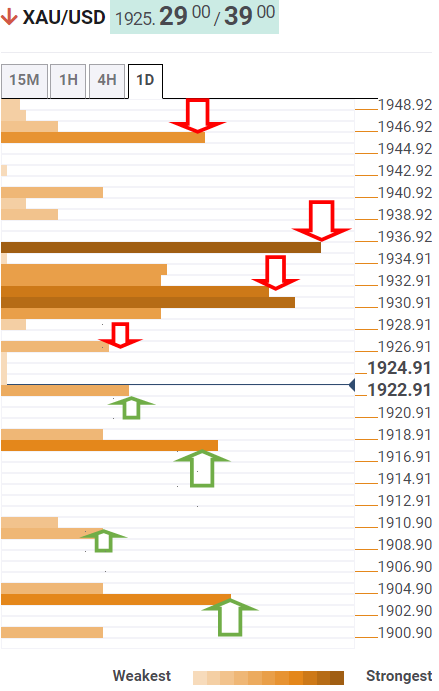
The Technical Confluences Detector shows that gold price is extending declines to test the pivot point one-day S1 at $1,923.
Acceptance below that level will call on sellers to target strong support at $1,918, which is the convergence of the Fibonacci 23.6% one-week, the previous day’s low and Bollinger Band four-hour Lower.
If the sell-off intensifies, then a sharp drop towards the confluence of the SMA200 four-hour and the pivot point one-day S2 at $1,909 cannot be ruled out.
The intersection of the Fibonacci 161.8% one-day and Fibonacci 38.2% one-month at $1,904 will be a level to beat for gold bears.
Alternatively, if bulls jump back into the game, then immediate resistance is seen at $1,926, the Fibonacci 61.8% one-day.
Further up, gold bulls will need to find a strong foothold above a dense cluster of resistance levels around $1,931.
That level comprises of SMA5 one-day, SMA10 four-hour, Fibonacci 38.2% one-day and one-week.
The next powerful upside barrier is that of the Fibonacci 26.3% one-day, where the $1,936 level aligns.
The previous day’s high of $1,941 will be next on buyers’ radars on a sustained move higher.
Here is how it looks on the tool
About Technical Confluences Detector
The TCD (Technical Confluences Detector) is a tool to locate and point out those price levels where there is a congestion of indicators, moving averages, Fibonacci levels, Pivot Points, etc. If you are a short-term trader, you will find entry points for counter-trend strategies and hunt a few points at a time. If you are a medium-to-long-term trader, this tool will allow you to know in advance the price levels where a medium-to-long-term trend may stop and rest, where to unwind positions, or where to increase your position size.


© 2000-2026. Bản quyền Teletrade.
Trang web này được quản lý bởi Teletrade D.J. LLC 2351 LLC 2022 (Euro House, Richmond Hill Road, Kingstown, VC0100, St. Vincent and the Grenadines).
Thông tin trên trang web không phải là cơ sở để đưa ra quyết định đầu tư và chỉ được cung cấp cho mục đích làm quen.
Giao dịch trên thị trường tài chính (đặc biệt là giao dịch sử dụng các công cụ biên) mở ra những cơ hội lớn và tạo điều kiện cho các nhà đầu tư sẵn sàng mạo hiểm để thu lợi nhuận, tuy nhiên nó mang trong mình nguy cơ rủi ro khá cao. Chính vì vậy trước khi tiến hành giao dịch cần phải xem xét mọi mặt vấn đề chấp nhận tiến hành giao dịch cụ thể xét theo quan điểm của nguồn lực tài chính sẵn có và mức độ am hiểu thị trường tài chính.
Sử dụng thông tin: sử dụng toàn bộ hay riêng biệt các dữ liệu trên trang web của công ty TeleTrade như một nguồn cung cấp thông tin nhất định. Việc sử dụng tư liệu từ trang web cần kèm theo liên kết đến trang teletrade.vn. Việc tự động thu thập số liệu cũng như thông tin từ trang web TeleTrade đều không được phép.
Xin vui lòng liên hệ với pr@teletrade.global nếu có câu hỏi.
ngân hàng