- Phân tích
- Tin tức và các công cụ
- Tin tức thị trường
- Gold Price Forecast: XAU/USD key levels to watch amid cautious markets – Confluence Detector
Gold Price Forecast: XAU/USD key levels to watch amid cautious markets – Confluence Detector
- Gold’s fate hinges on the US bond market action, Ukraine updates.
- The US dollar draws renewed safe-haven demand amid firmer Treasury yields.
- Gold price turns bearish with technicals amid bond rout, 50-DMA back in sight.
Gold price continues to remain at the mercy of the dynamics in the US bond market and the developments surrounding the Russia-Ukraine crisis. Gold price has enjoyed good two-way businesses so far this Monday, although the renewed upside lacks follow-through momentum. Risk sentiment has turned sour as the EU readies more sanctions against Russia, which will buoy the safe-haven US dollar’s demand at gold’s expense. Further, the hawkish Fed’s outlook-led rally in the US Treasury yields is also likely to keep gold sellers cheerful, in the absence of top-tier economic events.
Read: Will commodities continue to outperform In Q2 2022? [Video]
Gold Price: Key levels to watch
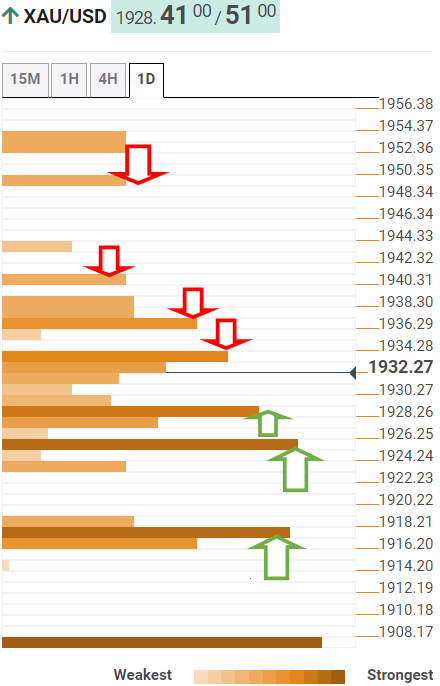
The Technical Confluences Detector shows that gold price is testing offers at powerful resistance of the Fibonacci 61.8% one-week at $1,934.
If the latter is scaled, then gold bulls will face the next relevant resistance around $1,937, which is the confluence of the pivot point one-day R1, SMA 50, 100 and 200 four-hour.
The previous day’s high at $1,940 will test the bearish commitment further up. A sustained break above that level will fuel a fresh rally towards the pivot point one-day R2 at $1,949.
On the flip side, gold sellers are attacking strong support at $1,928, which is the SMA5 one-day.
The next downside target aligns at $1,925, the confluence of the SMA5 four-hour and the Fibonacci 23.6% one-day.
Fierce cap at around $1,917 will be the last resort for gold bulls, as the latter is the intersection of the Fibonacci 38.2% one-week, the previous day’s low and the pivot point one-day S1.
Here is how it looks on the tool
About Technical Confluences Detector
The TCD (Technical Confluences Detector) is a tool to locate and point out those price levels where there is a congestion of indicators, moving averages, Fibonacci levels, Pivot Points, etc. If you are a short-term trader, you will find entry points for counter-trend strategies and hunt a few points at a time. If you are a medium-to-long-term trader, this tool will allow you to know in advance the price levels where a medium-to-long-term trend may stop and rest, where to unwind positions, or where to increase your position size.


© 2000-2026. Bản quyền Teletrade.
Trang web này được quản lý bởi Teletrade D.J. LLC 2351 LLC 2022 (Euro House, Richmond Hill Road, Kingstown, VC0100, St. Vincent and the Grenadines).
Thông tin trên trang web không phải là cơ sở để đưa ra quyết định đầu tư và chỉ được cung cấp cho mục đích làm quen.
Giao dịch trên thị trường tài chính (đặc biệt là giao dịch sử dụng các công cụ biên) mở ra những cơ hội lớn và tạo điều kiện cho các nhà đầu tư sẵn sàng mạo hiểm để thu lợi nhuận, tuy nhiên nó mang trong mình nguy cơ rủi ro khá cao. Chính vì vậy trước khi tiến hành giao dịch cần phải xem xét mọi mặt vấn đề chấp nhận tiến hành giao dịch cụ thể xét theo quan điểm của nguồn lực tài chính sẵn có và mức độ am hiểu thị trường tài chính.
Sử dụng thông tin: sử dụng toàn bộ hay riêng biệt các dữ liệu trên trang web của công ty TeleTrade như một nguồn cung cấp thông tin nhất định. Việc sử dụng tư liệu từ trang web cần kèm theo liên kết đến trang teletrade.vn. Việc tự động thu thập số liệu cũng như thông tin từ trang web TeleTrade đều không được phép.
Xin vui lòng liên hệ với pr@teletrade.global nếu có câu hỏi.
ngân hàng