- Phân tích
- Tin tức và các công cụ
- Tin tức thị trường
- Silver Price Forecast: XAG/USD bulls march firmly towards $26.00 on a soft greenback
Silver Price Forecast: XAG/USD bulls march firmly towards $26.00 on a soft greenback
- A positive market mood, falling US bond yields, and a weaker buck, a tailwind for precious metals and commodities.
- Hotter than expected, US PPI inflation reinforces a 50-bps increase by the Fed.
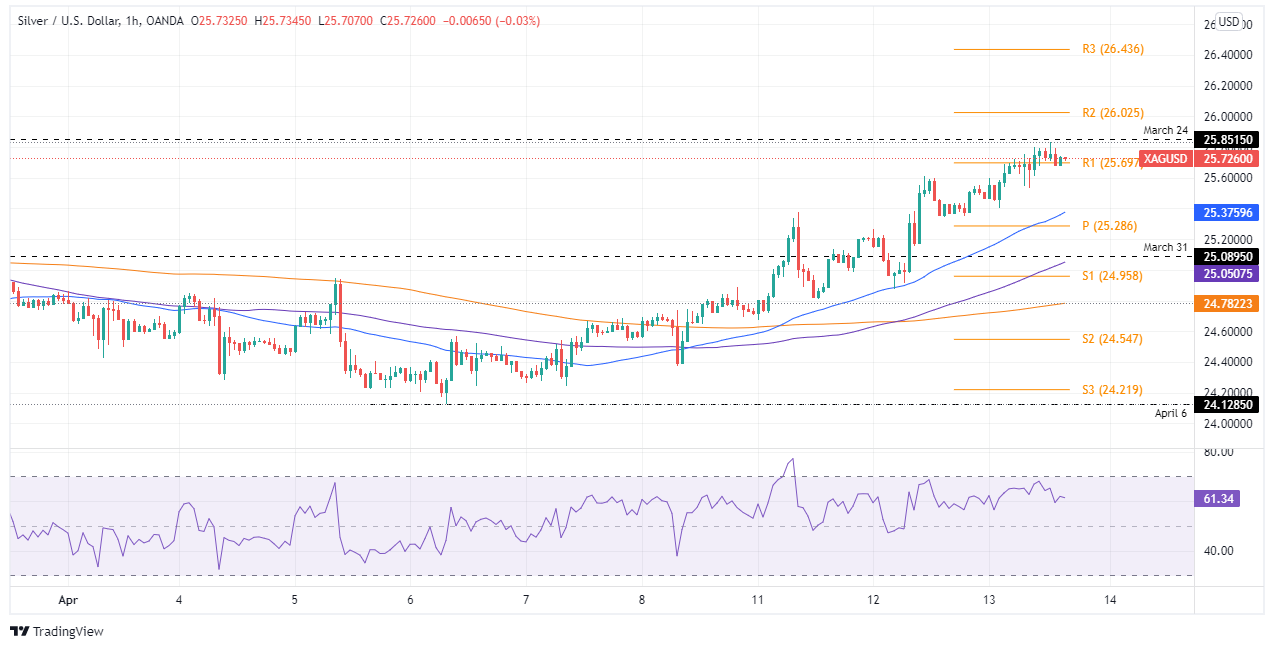
- Silver Price Forecast (XAG/USD): Remains upward biased, and a daily close above $25.85 would open the door for bulls towards $26.00
Silver (XAG/USD) rallies for the sixth consecutive day, in the middle of an upbeat market mood, taking advantage of fallings US Treasury yields, high US inflation figures, and despite the continuation of hostilities between Ukraine-Russia. At the time of writing, XAG/USD is trading at $25.72 and continues to aim towards $26.00.
Risk appetite increased throughout the North American session, as portrayed by US equities gaining. US Treasury yields fell, with the 10-year clinging to the 2.70% threshold, while the greenback fell.
High US inflation lays the ground for a Federal Reserve 50 bps hike
The ongoing week US economic docket keeps traders entertained. On Wednesday, consumer inflation rose to 8.5% y/y, higher than estimations but within the range. At the same time, the so-called core Consumer Price Index (CPI) increased 6.5% y/y, though lower than the 6.7% expected, a signal that inflation might be about to peak.
Nevertheless, prices paid for producers sent the hopes over the board on Thursday. The Producer Price Index (PPI) expanded by 11.2%, higher than the 10.8% y/y estimations, while core PPI hit 9.2% y/y, substantially up than the 8.4% estimations.
With both reports in the rearview mirror reinforces pressure on the Federal Reserve to raise rates at a faster pace. Fed officials have opened the door for 50-bps rate hikes at its May meeting, while STIRs shows a 94% chance of a 0.50% lift to the Federal Funds Rate (FFR).
Elsewhere precious metals extend their gains in the week. Silver is up close to 4%, while Gold gains 1.5%, trading at $1976 a troy ounce.
The US economic docket would unveil Retail Sales, Initial Jobless Claims, and the University of Michigan Consumer Sentiment survey by Thursday.
Silver Price Forecast (XAG/USD): Technical outlook
Silver’s (XAG/USD) daily chart depicts the pair as upward biased. The daily moving averages (DMAs) below the spot price confirmed the previously mentioned, though it’s worth noting that the 200-DMA at $23.89 is trapped between the 50-DMA at $24.61 and the 100-DMA at $23.74.
Silver’s 1-hour chart bias is aligned with the daily chart, and the uptrend is intact. The price action of the last two candlesticks shows that the rally is overextended, further confirmed by the Relative Strength Index (RSI) at 61.63, close to reaching overbought conditions.
Upwards, the XAG/USD first resistance would be the confluence of the March 24 cycle high and the R1 pivot point around the $25.75-85 range. A breach of the latter would expose the psychological $26.00 mark, followed by the R3 pivot at $26.43.
On the downside, the XAG/USD first support would be the 50-hour simple moving average (SMA) at $25.37. Once cleared, the next support would be the confluence of March 31 and the 100-hour SMA around the $25.05-09 range, followed by the 200-hour SMA at $24.78.


© 2000-2026. Bản quyền Teletrade.
Trang web này được quản lý bởi Teletrade D.J. LLC 2351 LLC 2022 (Euro House, Richmond Hill Road, Kingstown, VC0100, St. Vincent and the Grenadines).
Thông tin trên trang web không phải là cơ sở để đưa ra quyết định đầu tư và chỉ được cung cấp cho mục đích làm quen.
Giao dịch trên thị trường tài chính (đặc biệt là giao dịch sử dụng các công cụ biên) mở ra những cơ hội lớn và tạo điều kiện cho các nhà đầu tư sẵn sàng mạo hiểm để thu lợi nhuận, tuy nhiên nó mang trong mình nguy cơ rủi ro khá cao. Chính vì vậy trước khi tiến hành giao dịch cần phải xem xét mọi mặt vấn đề chấp nhận tiến hành giao dịch cụ thể xét theo quan điểm của nguồn lực tài chính sẵn có và mức độ am hiểu thị trường tài chính.
Sử dụng thông tin: sử dụng toàn bộ hay riêng biệt các dữ liệu trên trang web của công ty TeleTrade như một nguồn cung cấp thông tin nhất định. Việc sử dụng tư liệu từ trang web cần kèm theo liên kết đến trang teletrade.vn. Việc tự động thu thập số liệu cũng như thông tin từ trang web TeleTrade đều không được phép.
Xin vui lòng liên hệ với pr@teletrade.global nếu có câu hỏi.
ngân hàng