- Phân tích
- Tin tức và các công cụ
- Tin tức thị trường
- Gold Price Forecast: XAU/USD rebound remains elusive below $1,835 – Confluence Detector
Gold Price Forecast: XAU/USD rebound remains elusive below $1,835 – Confluence Detector
- Gold fades recovery from three-month low as market’s optimism fades ahead of the key catalysts.
- Softer US data, covid updates from China favored previous rebound, US Retail Sales, Fed’s Powell eyed for fresh impulse.
- Fibonacci 38.2% on one week appears a wall of resistance, pullback has multiple stops beyond $1,800.
Gold (XAU/USD) prices struggle to extend the previous day’s rebound from a quarter’s low as market sentiment dwindles heading into crucial data/events up for publishing on Tuesday. The yellow metal cheers the overall US dollar weakness and risk-on mood while defending the $1,800 threshold, around $1,825 by the press time.
The US Dollar Index (DXY) prints a three-day downtrend after refreshing the 20-year high amid indecision over the Fed’s next move. Recently downbeat US NY Fed Manufacturing Index and downbeat Fedspeak seem to have weighed on the risk appetite. Elsewhere, covid hopes in China and expectations of a July hike by the European Central Bank (ECB), per Reuters, also weigh on the USD, which in turn favors gold buyers. However, today’s US Retail Sales for April, expected at 0.7% versus 0.5% prior, as well as a speech from Fed Chairman Jerome Powell, becomes crucial for near-term directions for gold price.
Also read: Gold Price Forecast: XAU/USD bulls eye $1,842 on firmer sentiment ahead of US data, Fed’s Powell
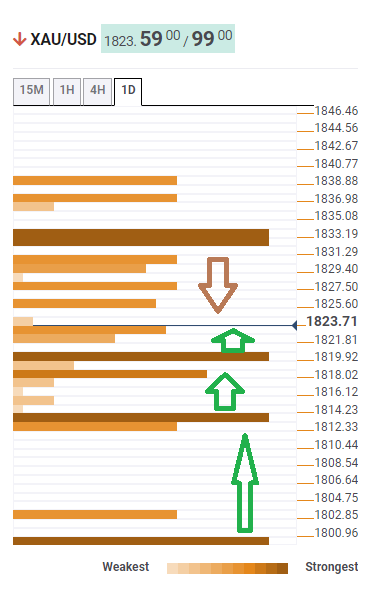
Gold Price: Key levels to watch
The Technical Confluences Detector shows that the Gold Price stays above multiple key supports beyond $1,800, suggesting further upside towards the $1.832-35 resistance zone including 38.2% Fibonacci on one week.
Following that, the 200-DMA and Pivot Point 1 R1, respectively around $1,837 and $1,840, may test the gold buyers before directing them to the mid-May swing high surrounding $1,858 will lure the market’s attention.
Alternatively, 38.2% Fibonacci on one week offers immediate support to the gold prices of around $1,820.
Following that, a convergence of the SMA10 on 4H and SMA 100 for 15-minutes will test the gold sellers for around $1,813.
It should be noted, however, that the XAU/USD weakness past $1,813 will make it vulnerable to testing the previous weekly low surrounding $1,800.
To sum up, gold has limited upside room but the pullback also has to witness multiple barriers to the south.
Here is how it looks on the tool
About Technical Confluences Detector
The TCD (Technical Confluences Detector) is a tool to locate and point out those price levels where there is a congestion of indicators, moving averages, Fibonacci levels, Pivot Points, etc. If you are a short-term trader, you will find entry points for counter-trend strategies and hunt a few points at a time. If you are a medium-to-long-term trader, this tool will allow you to know in advance the price levels where a medium-to-long-term trend may stop and rest, where to unwind positions, or where to increase your position size.


© 2000-2026. Bản quyền Teletrade.
Trang web này được quản lý bởi Teletrade D.J. LLC 2351 LLC 2022 (Euro House, Richmond Hill Road, Kingstown, VC0100, St. Vincent and the Grenadines).
Thông tin trên trang web không phải là cơ sở để đưa ra quyết định đầu tư và chỉ được cung cấp cho mục đích làm quen.
Giao dịch trên thị trường tài chính (đặc biệt là giao dịch sử dụng các công cụ biên) mở ra những cơ hội lớn và tạo điều kiện cho các nhà đầu tư sẵn sàng mạo hiểm để thu lợi nhuận, tuy nhiên nó mang trong mình nguy cơ rủi ro khá cao. Chính vì vậy trước khi tiến hành giao dịch cần phải xem xét mọi mặt vấn đề chấp nhận tiến hành giao dịch cụ thể xét theo quan điểm của nguồn lực tài chính sẵn có và mức độ am hiểu thị trường tài chính.
Sử dụng thông tin: sử dụng toàn bộ hay riêng biệt các dữ liệu trên trang web của công ty TeleTrade như một nguồn cung cấp thông tin nhất định. Việc sử dụng tư liệu từ trang web cần kèm theo liên kết đến trang teletrade.vn. Việc tự động thu thập số liệu cũng như thông tin từ trang web TeleTrade đều không được phép.
Xin vui lòng liên hệ với pr@teletrade.global nếu có câu hỏi.
ngân hàng