- Phân tích
- Tin tức và các công cụ
- Tin tức thị trường
- Gold Price Forecast: XAU/USD upside appears compelling beyond $1,834 – Confluence Detector
Gold Price Forecast: XAU/USD upside appears compelling beyond $1,834 – Confluence Detector
- Gold keeps the upside break of $1,834 key hurdle around weekly top.
- Stock futures rise, yields drop amid sluggish markets, mixed clues.
- The path of least resistance appears up but the USD rebound can test the bulls.
Gold Price remains sidelined around one-week high after crossing the short-term crucial hurdles the previous day. That said, the metal approaches another key resistance, around $1,848, as bulls cheer the previous breakout of the 200-DMA and monthly resistance line, not to forget Fibonacci 38.2% one-week.
Softer US data and repeated chatters of 50 bps Fed rate hike seem to have weighed the US dollar, which in turn allows the gold prices to regain upside momentum. The XAU/USD advances also take clues from the recently firmer stock futures and downbeat US Treasury yields as traders seek clear directions on the major central banks’ next moves. The market’s indecision joins a lack of major data/events to trigger gold’s consolidation move, as it braces for the first weekly gains in five. Moving on, a light calendar and mixed updates may keep the gold prices higher unless any surprise macro propels the US dollar buying.
Also read: Gold Price Forecast: XAUUSD bulls recapture 200-DMA, more gains likely?
Gold Price: Key levels to watch
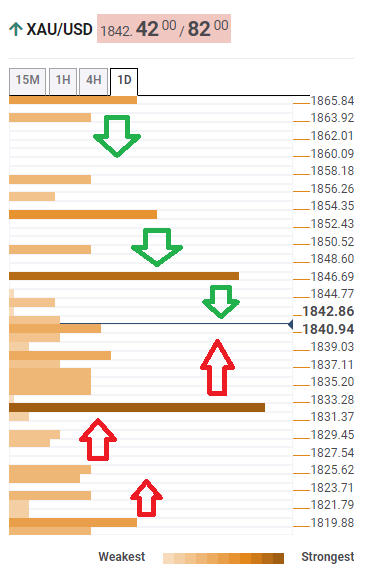
The Technical Confluences Detector shows that the Gold Price stays firmer after crossing the Fibonacci 38.2% one-week, as well as SMA100 on 15-minute, close to $1,834.
Also justifying the bullish bias is the XAU/USD’s sustained trading beyond the 200-DMA and Fibonacci 38.2% one-week, respectively around $1,840 and $1,838.
It’s worth noting that Fibonacci 23.6% one-week and SMA100 on hourly chart portrays another important support around $1,820.
That said, the Gold Price aims $1,848 hurdle comprising upper Bollinger on 4H and Pivot Point 1Month S1.
Should the quote rises past $1,848, the Fibonacci 61.8% one-week and upper Bollinger on hourly play could lure the XAU/USD buyers around $1,855.
Here is how it looks on the tool
About Technical Confluences Detector
The TCD (Technical Confluences Detector) is a tool to locate and point out those price levels where there is a congestion of indicators, moving averages, Fibonacci levels, Pivot Points, etc. If you are a short-term trader, you will find entry points for counter-trend strategies and hunt a few points at a time. If you are a medium-to-long-term trader, this tool will allow you to know in advance the price levels where a medium-to-long-term trend may stop and rest, where to unwind positions, or where to increase your position size.


© 2000-2026. Bản quyền Teletrade.
Trang web này được quản lý bởi Teletrade D.J. LLC 2351 LLC 2022 (Euro House, Richmond Hill Road, Kingstown, VC0100, St. Vincent and the Grenadines).
Thông tin trên trang web không phải là cơ sở để đưa ra quyết định đầu tư và chỉ được cung cấp cho mục đích làm quen.
Giao dịch trên thị trường tài chính (đặc biệt là giao dịch sử dụng các công cụ biên) mở ra những cơ hội lớn và tạo điều kiện cho các nhà đầu tư sẵn sàng mạo hiểm để thu lợi nhuận, tuy nhiên nó mang trong mình nguy cơ rủi ro khá cao. Chính vì vậy trước khi tiến hành giao dịch cần phải xem xét mọi mặt vấn đề chấp nhận tiến hành giao dịch cụ thể xét theo quan điểm của nguồn lực tài chính sẵn có và mức độ am hiểu thị trường tài chính.
Sử dụng thông tin: sử dụng toàn bộ hay riêng biệt các dữ liệu trên trang web của công ty TeleTrade như một nguồn cung cấp thông tin nhất định. Việc sử dụng tư liệu từ trang web cần kèm theo liên kết đến trang teletrade.vn. Việc tự động thu thập số liệu cũng như thông tin từ trang web TeleTrade đều không được phép.
Xin vui lòng liên hệ với pr@teletrade.global nếu có câu hỏi.
ngân hàng