- Phân tích
- Tin tức và các công cụ
- Tin tức thị trường
- Gold Price Forecast: Battle lines well-defined for XAUUSD amid light trading – Confluence Detector
Gold Price Forecast: Battle lines well-defined for XAUUSD amid light trading – Confluence Detector
- Gold Price is supported above $1,850 amid holiday-thinned trading.
- US dollar remains on the defensive amid a risk-on market mood.
- XAUUSD is struggling amid a bunch of healthy resistance and support levels.
Gold Price is giving a part of its early gains but appears supported amid holiday-thinned market conditions. The US dollar is seeing a dip-buying demand, despite the risk-on trading on global stocks. Investors continue assessing the China covid easing optimism and subsiding aggressive Fed’s tightening bets against signs of slowing in the US economy. Therefore, gold price is seen fluctuating between gains and losses while defending the $1,850 barrier. The EU Summit on Ukraine crisis is closely followed, as Russia’s oil embargo is likely to be part of EU sanctions package. These developments could affect the broader market sentiment, significantly impacting the dollar and XAUUSD price.
Also read: Gold Price Forecast: XAUUSD buyers seize control in the NFP week, $1,870 in sight
Gold Price: Key levels to watch
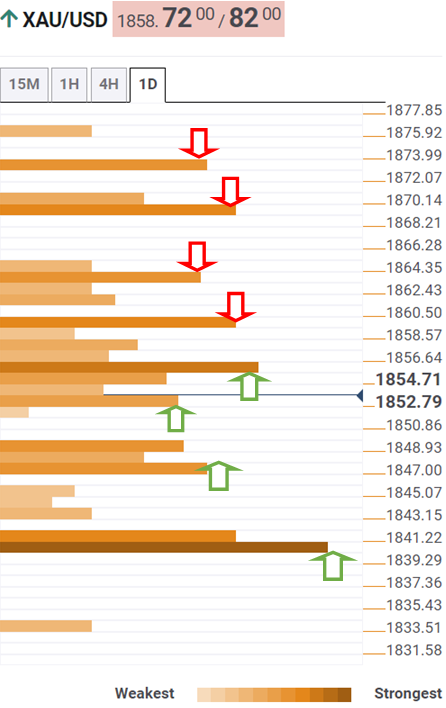
The Technical Confluences Detector shows that the Gold Price is battling strong resistance at $1,860, which is the meeting point of the Fibonacci 23.6% one-day and Fibonacci 38.2% one-week.
The previous high four-hour and the Fibonacci 23.6% one-week at $1,864 will be tested next by gold buyers.
A sustained move above the latter will see a fresh advance towards the previous week’s high of $1,870. At that point, the pivot point one-week R1 and pivot point one-day R2 align.
The previous month’s low of $1,872 will be the level to beat for XAU bulls.
Alternatively, a firm break below the SMA5 one-day at $1,855 will put the Fibonacci 61.8% one-week at $1,852 to test.
The next critical support zone is seen at around $1,848, which is the confluence of the previous day’s low, pivot point one-month S1 and SMA50 four-hour.
The line in the sand for gold bulls is seen at $1,840, the intersection of the pivot point one-day S2, SMA200 one-day and the previous week’s low.
Here is how it looks on the tool
About Technical Confluences Detector
The TCD (Technical Confluences Detector) is a tool to locate and point out those price levels where there is a congestion of indicators, moving averages, Fibonacci levels, Pivot Points, etc. If you are a short-term trader, you will find entry points for counter-trend strategies and hunt a few points at a time. If you are a medium-to-long-term trader, this tool will allow you to know in advance the price levels where a medium-to-long-term trend may stop and rest, where to unwind positions, or where to increase your position size.


© 2000-2026. Bản quyền Teletrade.
Trang web này được quản lý bởi Teletrade D.J. LLC 2351 LLC 2022 (Euro House, Richmond Hill Road, Kingstown, VC0100, St. Vincent and the Grenadines).
Thông tin trên trang web không phải là cơ sở để đưa ra quyết định đầu tư và chỉ được cung cấp cho mục đích làm quen.
Giao dịch trên thị trường tài chính (đặc biệt là giao dịch sử dụng các công cụ biên) mở ra những cơ hội lớn và tạo điều kiện cho các nhà đầu tư sẵn sàng mạo hiểm để thu lợi nhuận, tuy nhiên nó mang trong mình nguy cơ rủi ro khá cao. Chính vì vậy trước khi tiến hành giao dịch cần phải xem xét mọi mặt vấn đề chấp nhận tiến hành giao dịch cụ thể xét theo quan điểm của nguồn lực tài chính sẵn có và mức độ am hiểu thị trường tài chính.
Sử dụng thông tin: sử dụng toàn bộ hay riêng biệt các dữ liệu trên trang web của công ty TeleTrade như một nguồn cung cấp thông tin nhất định. Việc sử dụng tư liệu từ trang web cần kèm theo liên kết đến trang teletrade.vn. Việc tự động thu thập số liệu cũng như thông tin từ trang web TeleTrade đều không được phép.
Xin vui lòng liên hệ với pr@teletrade.global nếu có câu hỏi.
ngân hàng