- Phân tích
- Tin tức và các công cụ
- Tin tức thị trường
- Gold Price Forecast: XAUUSD eyes $1,845 and $1,842 on aggressive Fed tightening bets – Confluence Detector
Gold Price Forecast: XAUUSD eyes $1,845 and $1,842 on aggressive Fed tightening bets – Confluence Detector
- Gold Price slips from five-week highs as Fed set to hike rate aggressively.
- The US dollar, yields soar on the Fed expectations and risk-off flows.
- XAUUSD remains exposed to more downside ahead of the Fed decision.
Gold Price is correcting sharply from five-week peaks of $1,879, reversing most of Friday’s strong rally. The inverse correlation between the US Treasury yields and the bright metal is back in play. The benchmark 10-year yields are trading at their highest level since 2018 on the bets that the Fed will go for a 75 bps rate hike at least once in its next three meetings to curb rampant inflation. The zero-yielding gold is feeling the heat of soaring yields, which have driven the US dollar higher alongside. Aggressive Fed tightening expectations have overshadowed heightening recession fears while influencing XAUUSD price. Markets now eagerly await Wednesday’s Fed decision for the rate hike guidance and its impact on the related assets.
Also read: Gold Price Forecast: 50 DMA could be a tough nut to crack, as focus shifts to Fed
Gold Price: Key levels to watch
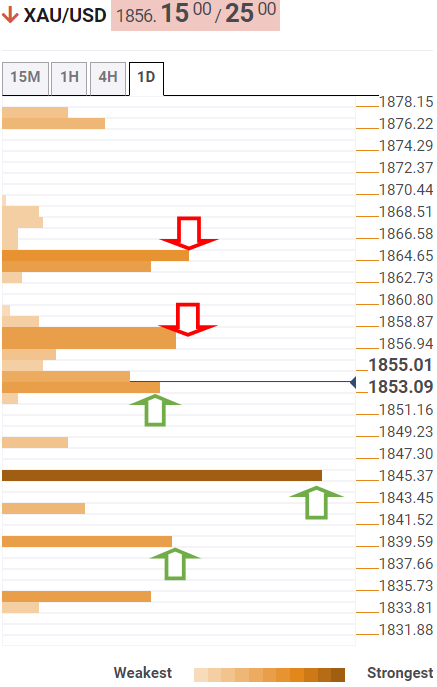
The Technical Confluence Detector shows that Gold Price challenged the fierce support at $1,853, which is the convergence of the SMA10 one-day and SMA200 four-hour.
The next significant downside target is pegged at $1,845, where the Fibonacci 61.8% one-day and one-week merge.
Further south, the SMA200 one-day at $1,842 will test the bullish commitments once again, opening floors for a retest of the pivot point one-week S1 and pivot point one-day S1 intersection at $1,839.
On the flip side, bulls test the confluence of the Fibonacci 38.21% one-day and one-month at $1,858, above which a fresh advance towards $1,863 cannot be ruled out.
At that level, the Fibonacci 61.8% one-month, Fibonacci 23.6% one-day and one-week coincide.
Friday’s high of $1,876 will be put to test should bulls resume the recent bullish momentum.
Here is how it looks on the tool
About Technical Confluences Detector
The TCD (Technical Confluences Detector) is a tool to locate and point out those price levels where there is a congestion of indicators, moving averages, Fibonacci levels, Pivot Points, etc. If you are a short-term trader, you will find entry points for counter-trend strategies and hunt a few points at a time. If you are a medium-to-long-term trader, this tool will allow you to know in advance the price levels where a medium-to-long-term trend may stop and rest, where to unwind positions, or where to increase your position size.


© 2000-2026. Bản quyền Teletrade.
Trang web này được quản lý bởi Teletrade D.J. LLC 2351 LLC 2022 (Euro House, Richmond Hill Road, Kingstown, VC0100, St. Vincent and the Grenadines).
Thông tin trên trang web không phải là cơ sở để đưa ra quyết định đầu tư và chỉ được cung cấp cho mục đích làm quen.
Giao dịch trên thị trường tài chính (đặc biệt là giao dịch sử dụng các công cụ biên) mở ra những cơ hội lớn và tạo điều kiện cho các nhà đầu tư sẵn sàng mạo hiểm để thu lợi nhuận, tuy nhiên nó mang trong mình nguy cơ rủi ro khá cao. Chính vì vậy trước khi tiến hành giao dịch cần phải xem xét mọi mặt vấn đề chấp nhận tiến hành giao dịch cụ thể xét theo quan điểm của nguồn lực tài chính sẵn có và mức độ am hiểu thị trường tài chính.
Sử dụng thông tin: sử dụng toàn bộ hay riêng biệt các dữ liệu trên trang web của công ty TeleTrade như một nguồn cung cấp thông tin nhất định. Việc sử dụng tư liệu từ trang web cần kèm theo liên kết đến trang teletrade.vn. Việc tự động thu thập số liệu cũng như thông tin từ trang web TeleTrade đều không được phép.
Xin vui lòng liên hệ với pr@teletrade.global nếu có câu hỏi.
ngân hàng