- Phân tích
- Tin tức và các công cụ
- Tin tức thị trường
- EUR/JPY Price Analysis: Trims three days of losses and reclaims 141.00 on a risk-off mood
EUR/JPY Price Analysis: Trims three days of losses and reclaims 141.00 on a risk-off mood
- The euro recovered some ground vs. the Japanese yen amidst the scenario of Japanese authorities intervening in the FX markets.
- EUR/JPY Price Analysis: The formation of a bearish flag pattern in the 1-hour chart would open the door for further losses.
The EUR/JPY is snaping three days of consecutive losses, courtesy of last Friday’s verbal intervention by Japanese authorities, which spurred a dip from YTD highs at around 144.18 to 139.38, almost a 500 pip fall. However, on Tuesday, the EUR/JPY is recovering and erases 150 pips of losses, gaining 1.06%, and is trading at 141.06, as the New York session winds down.
Sentiment remains negative. Expectations that the US Federal Reserve would hike 75 bps mounted. Banks in Wall Street updated their Fed calls on Tuesday after an article by the WSJ that stated that due to high inflationary indicators, the US central bank would “surprisingly” hike 75 bps.
The aforementioned triggered a bloodbath in global equities, which remain on the defensive. US Treasury yields remain elevated, and the greenback rose.
The EUR/JPY got a boost, despite a dismal than expected EU data. As expected, inflation in Germany rose by 7.9% YoY in May, alongside other inflationary numbers that came in line as estimated. However, the Zew Economic Sentiment Index in the Euro area and Germany missed expectations. Nevertheless, it was ignored by traders.
EUR/JPY Price Analysis: Technical outlook
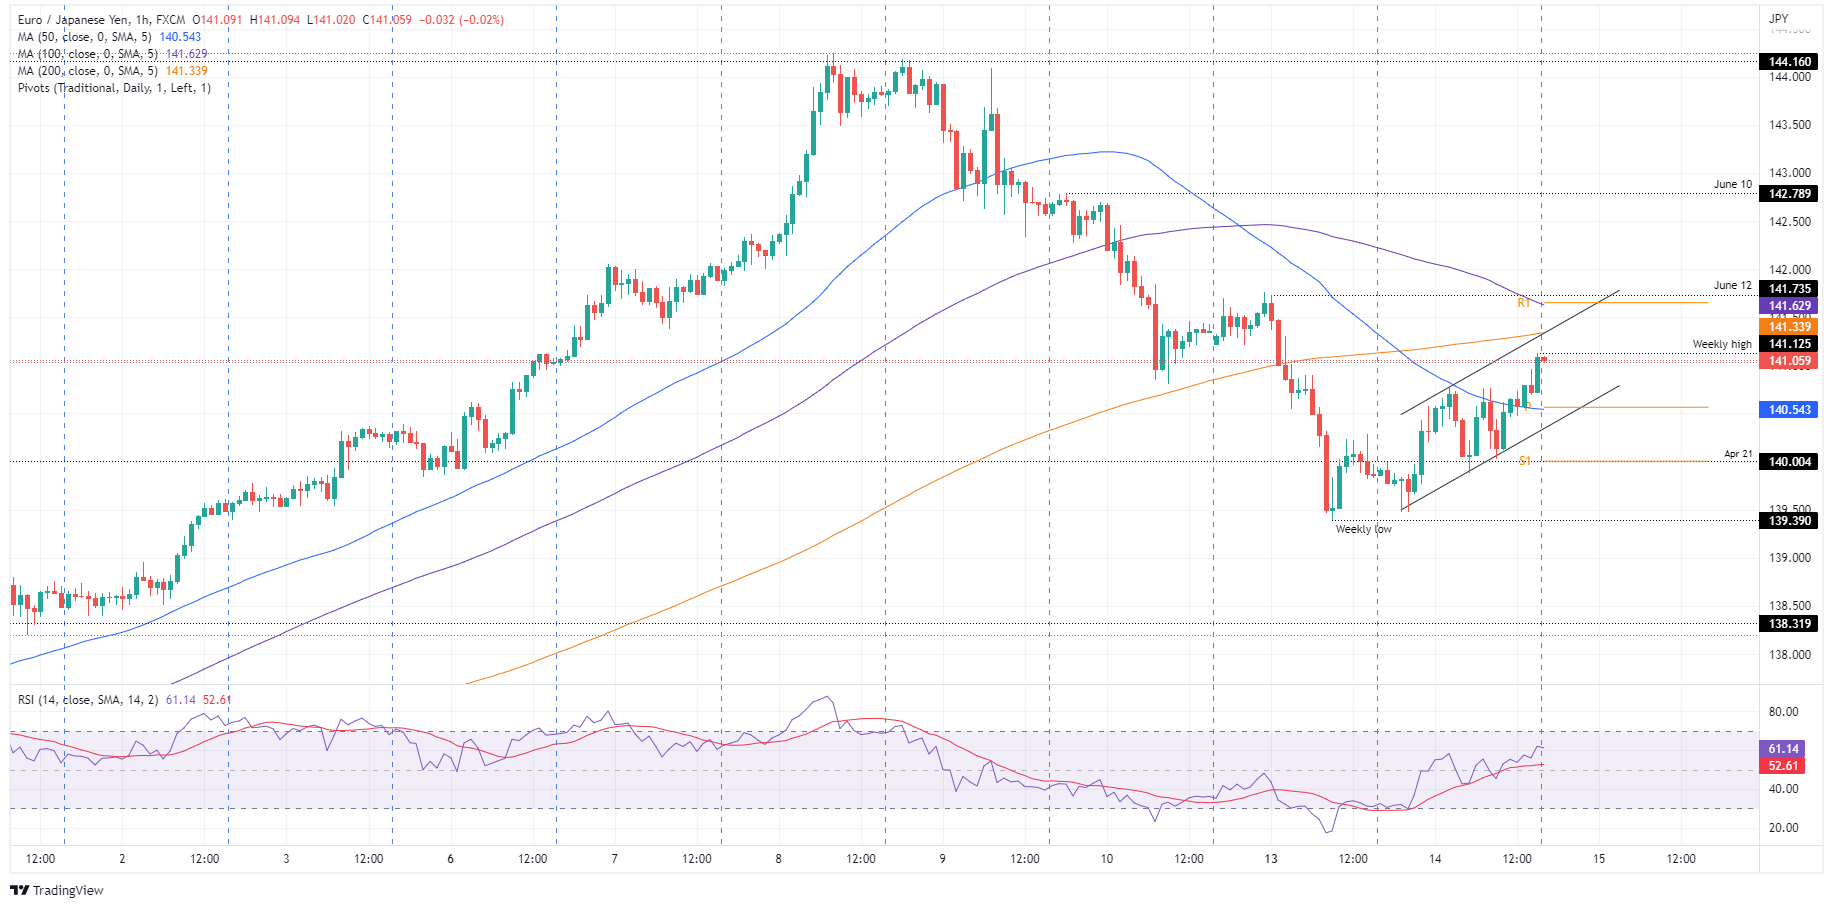
The EUR/JPY’s daily chart depicts the cross-currency as upward biased, but the RSI, albeit in the bullish territory, is trendless. That said, the EUR/JPY might consolidate in the near term in the 139.40-141.00 area.
The EUR/JPY’s 1-hour chart illustrates that the pair is confined to an uptrend channel, forming a bearish flag. Nevertheless, a break above the bearish flag-top trendline, which confluences with the 200-hour simple moving average (SMA) at 141.34, would open the door for a test of June’s 12 high, which confluences with the 100-hour SMA and the R1 daily pivot point around 141.76. If that scenario is completed, the following resistance would be June’s 10 high at 142.79.
However, the EUR/JPY path of least resistance is downwards. The EUR/JPY’s first support would be the confluence of the 50-hour SMA and the daily pivot at around 140.54. Break below would expose the bottom trendline of the bearish flag around 140.30-40, followed by the S1 daily pivot at 140.00.
Key Technical Levels


© 2000-2026. Bản quyền Teletrade.
Trang web này được quản lý bởi Teletrade D.J. LLC 2351 LLC 2022 (Euro House, Richmond Hill Road, Kingstown, VC0100, St. Vincent and the Grenadines).
Thông tin trên trang web không phải là cơ sở để đưa ra quyết định đầu tư và chỉ được cung cấp cho mục đích làm quen.
Giao dịch trên thị trường tài chính (đặc biệt là giao dịch sử dụng các công cụ biên) mở ra những cơ hội lớn và tạo điều kiện cho các nhà đầu tư sẵn sàng mạo hiểm để thu lợi nhuận, tuy nhiên nó mang trong mình nguy cơ rủi ro khá cao. Chính vì vậy trước khi tiến hành giao dịch cần phải xem xét mọi mặt vấn đề chấp nhận tiến hành giao dịch cụ thể xét theo quan điểm của nguồn lực tài chính sẵn có và mức độ am hiểu thị trường tài chính.
Sử dụng thông tin: sử dụng toàn bộ hay riêng biệt các dữ liệu trên trang web của công ty TeleTrade như một nguồn cung cấp thông tin nhất định. Việc sử dụng tư liệu từ trang web cần kèm theo liên kết đến trang teletrade.vn. Việc tự động thu thập số liệu cũng như thông tin từ trang web TeleTrade đều không được phép.
Xin vui lòng liên hệ với pr@teletrade.global nếu có câu hỏi.
ngân hàng