- Phân tích
- Tin tức và các công cụ
- Tin tức thị trường
- US Dollar Price Analysis: Bears taking out short-term structure, 103 vulnerable of a test below
US Dollar Price Analysis: Bears taking out short-term structure, 103 vulnerable of a test below
- DXY is being sold off on the shorter-term time frames, 103.13-eyed near-term, 102.39 thereafter.
- The bias remains bullish on the daily chart until a break of downside structure, or 101.297.
Despite the persistent message from Fed members that there is a ''need to raise interest rates 'a good deal more' over the coming months,'' the US dollar has been on the back foot.
While it has been breaking the short-term structure and the trend from 101.297, as illustrated below, the long-term bullish playbook remains very much in play, at least from a technical standpoint.
The following is a top-down analysis that arrives at a bullish bias for the longer term, albeit noting the prospects of a near-term significant correction on the shorter-term charts.
DXY H1 charts
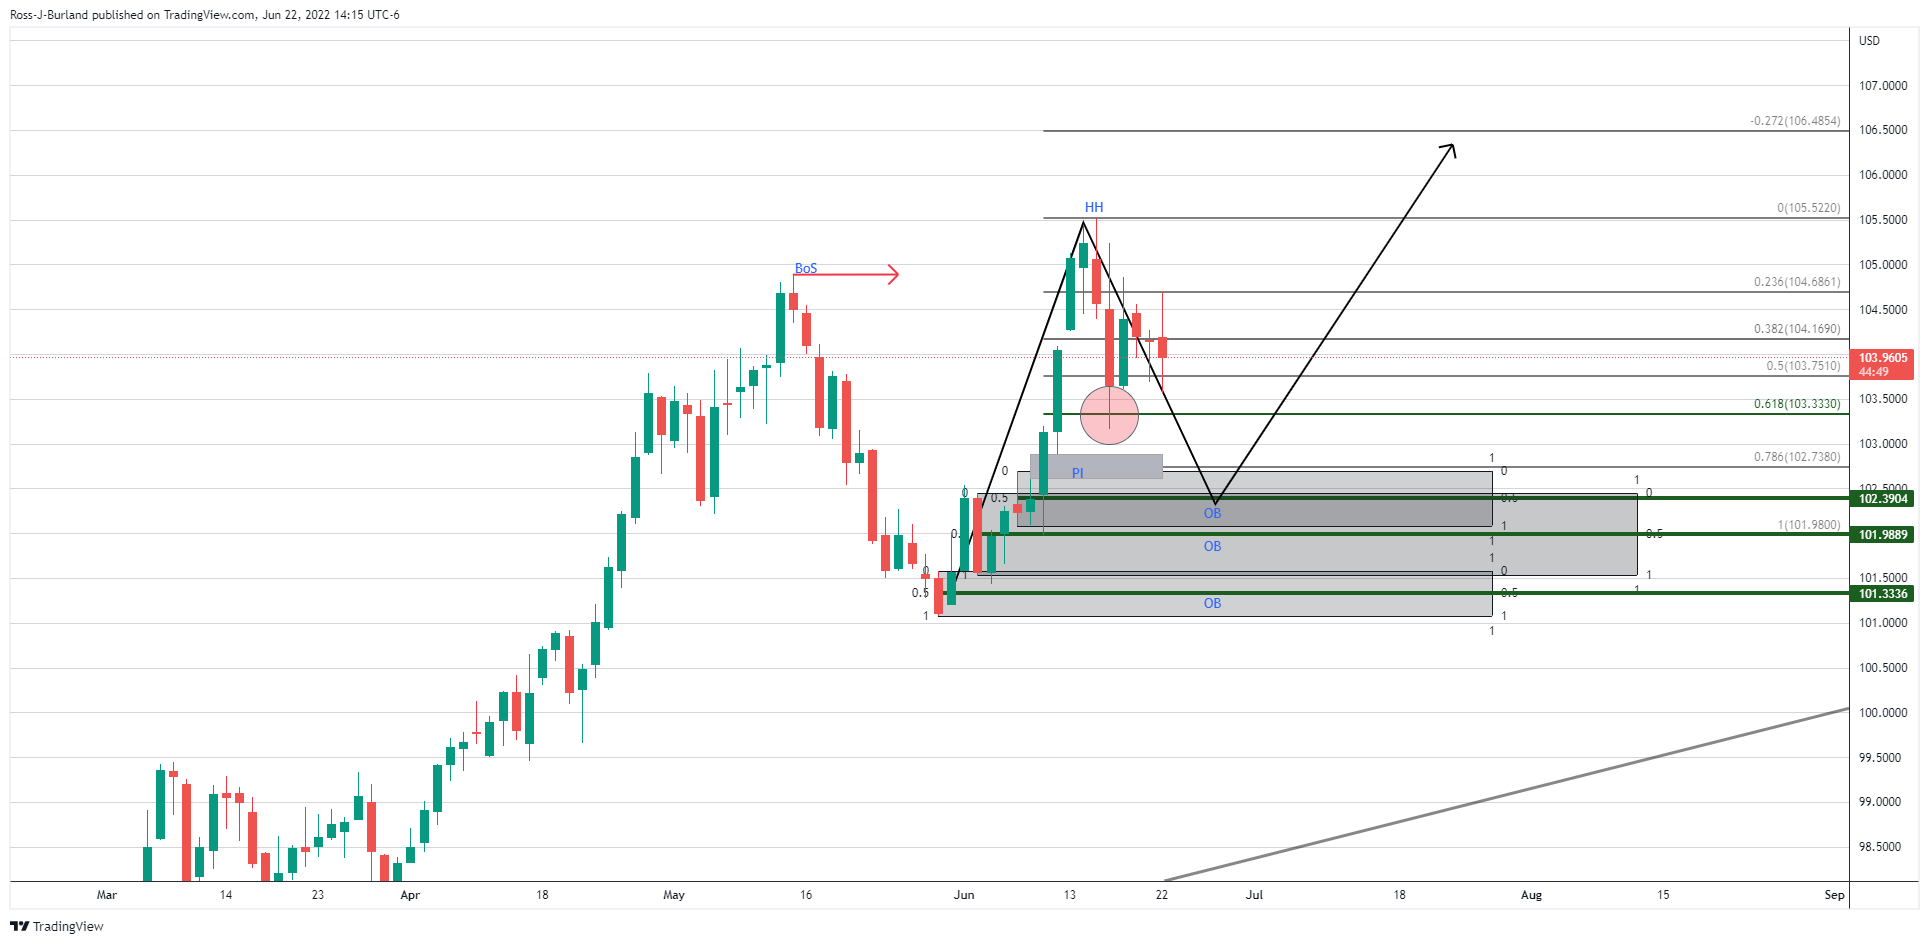
As illustrated in the hourly time frame, the price has broken the structure of the bullish short-term trend and the market is biased to the downside. Zooming in, we can see the market structure broken down through a lense:
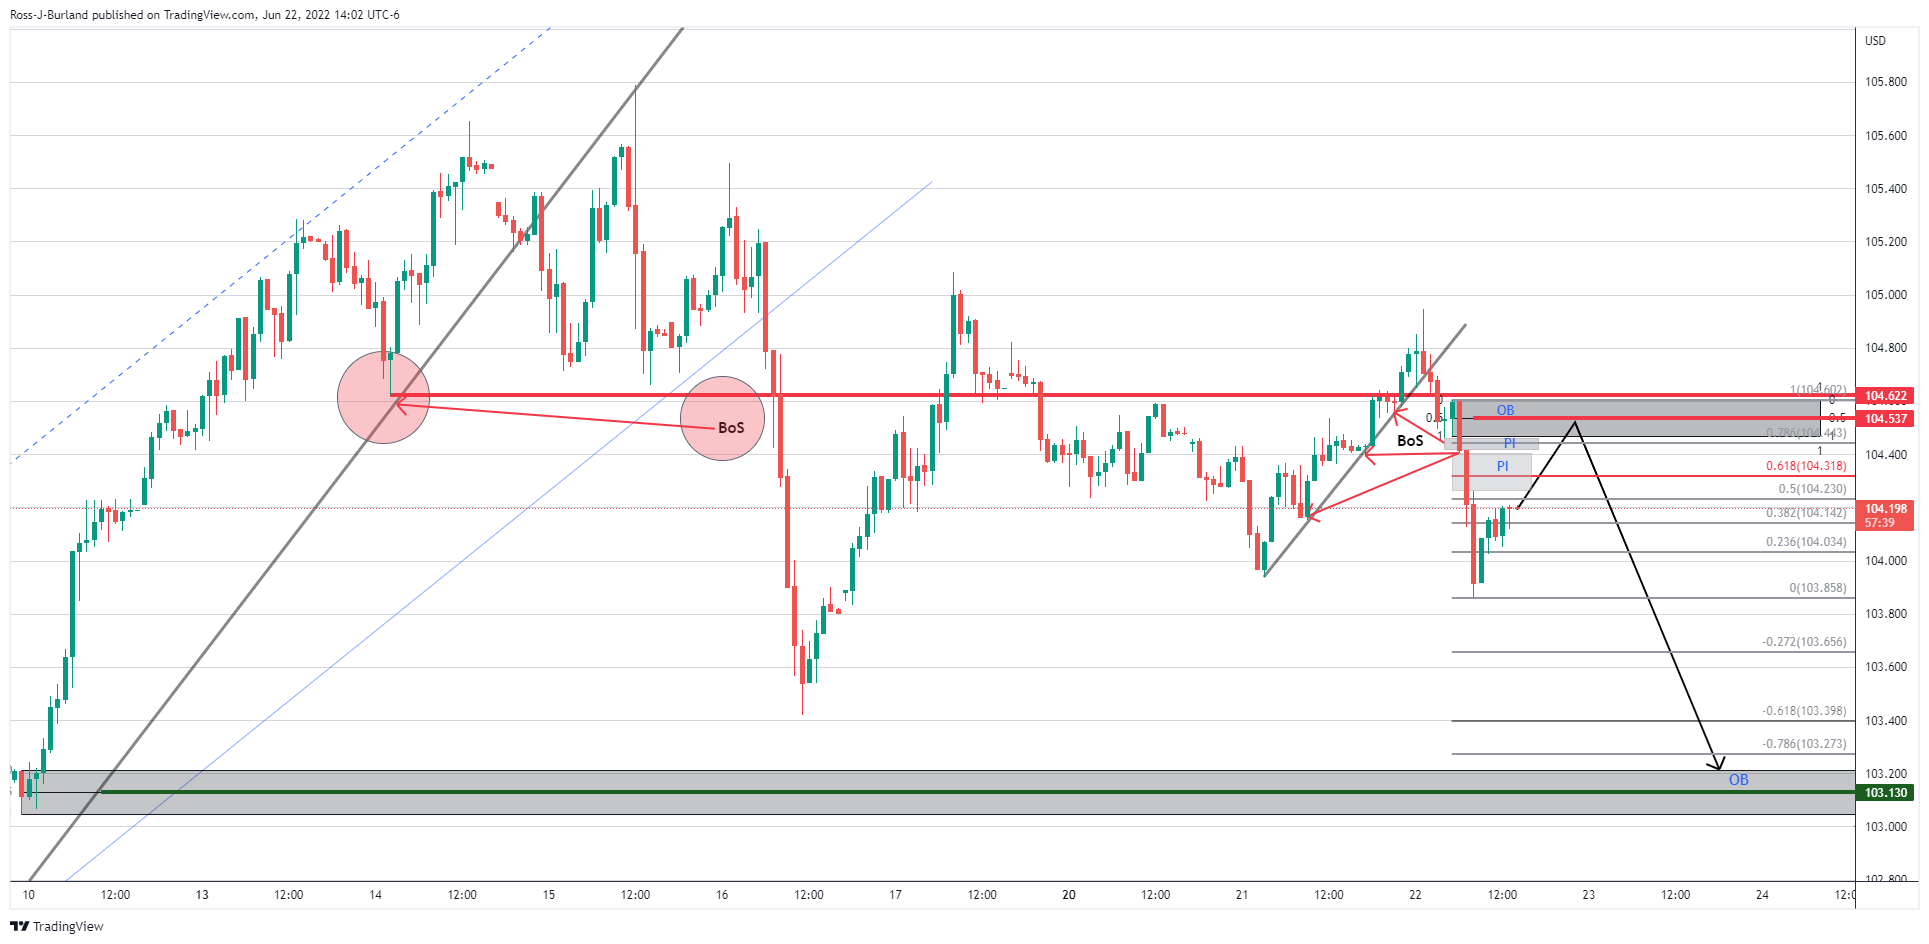
The recent bearish impulse took out a number of short-term higher lows in a break of structures (BoS). Therefore, the downside is to play for. However, there is a price imbalance that could be mitigated prior to a full-on move to the downside.
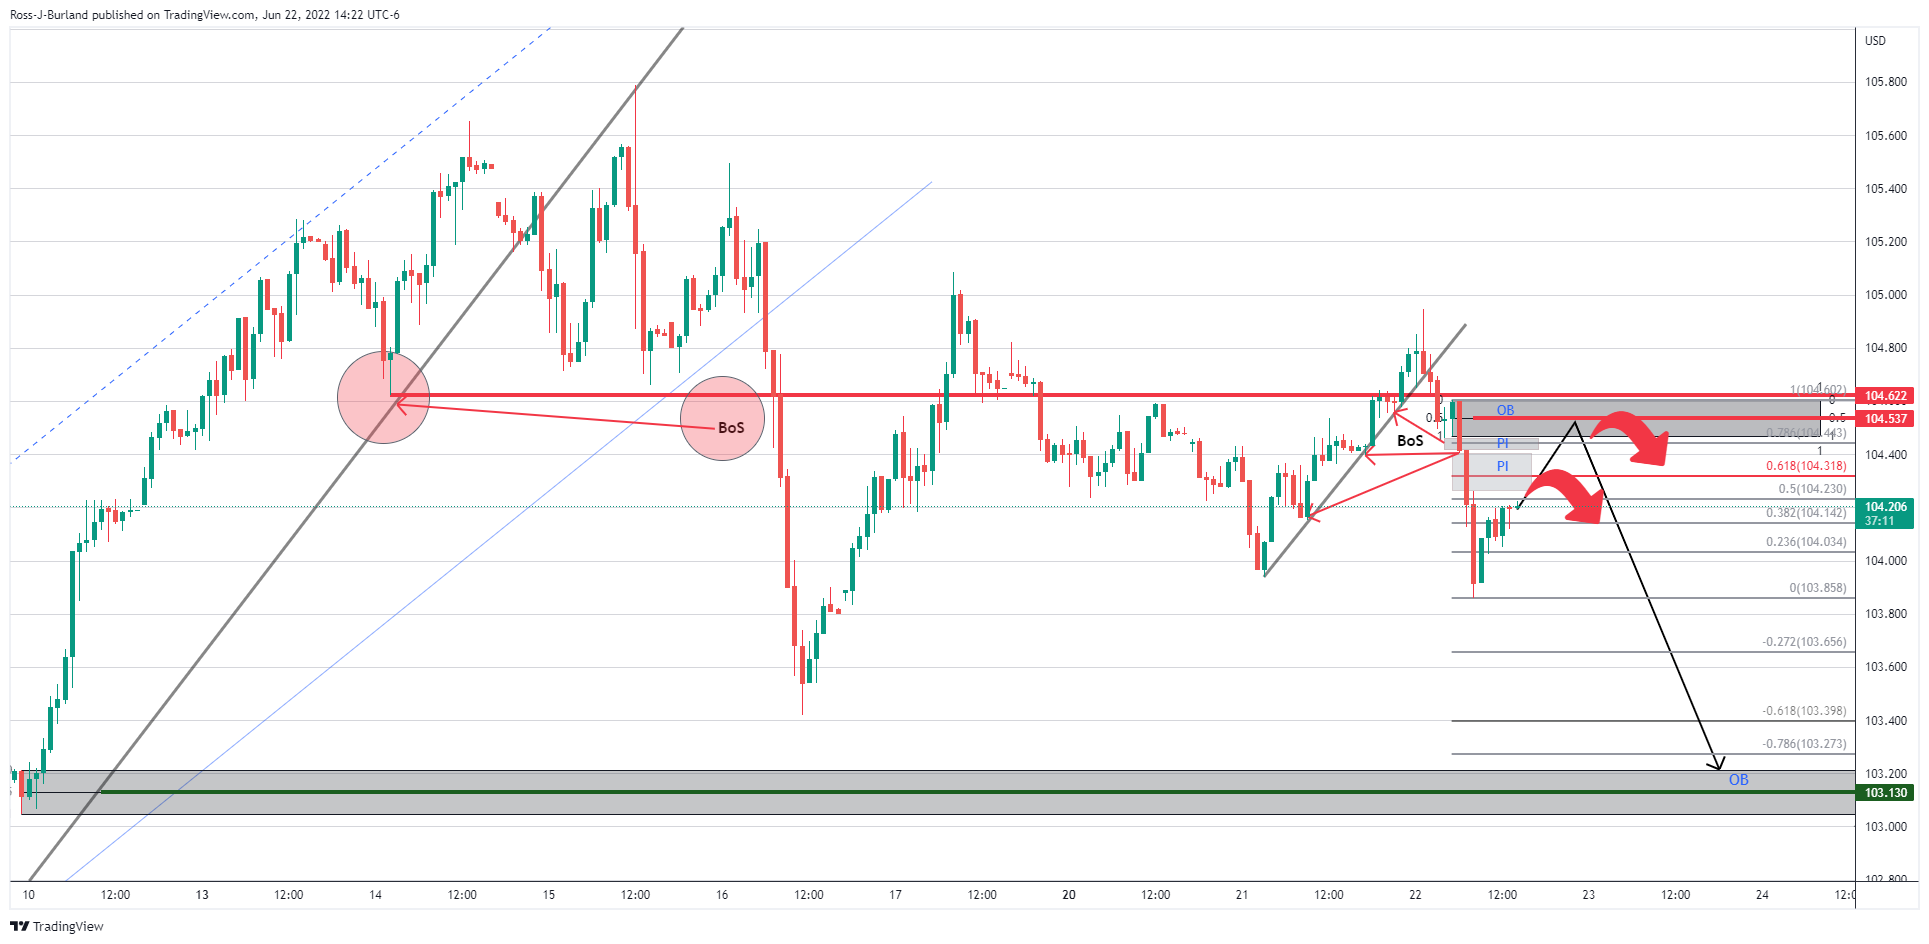
A 61.8% Fibo aligns with the first area of imbalance around 104.32. Thereafter, a restest of a liquidity area or 'order block' (OB) could be the last defence for a move down to the next significant demand area near 103.13, or there about.
DXY daily chart
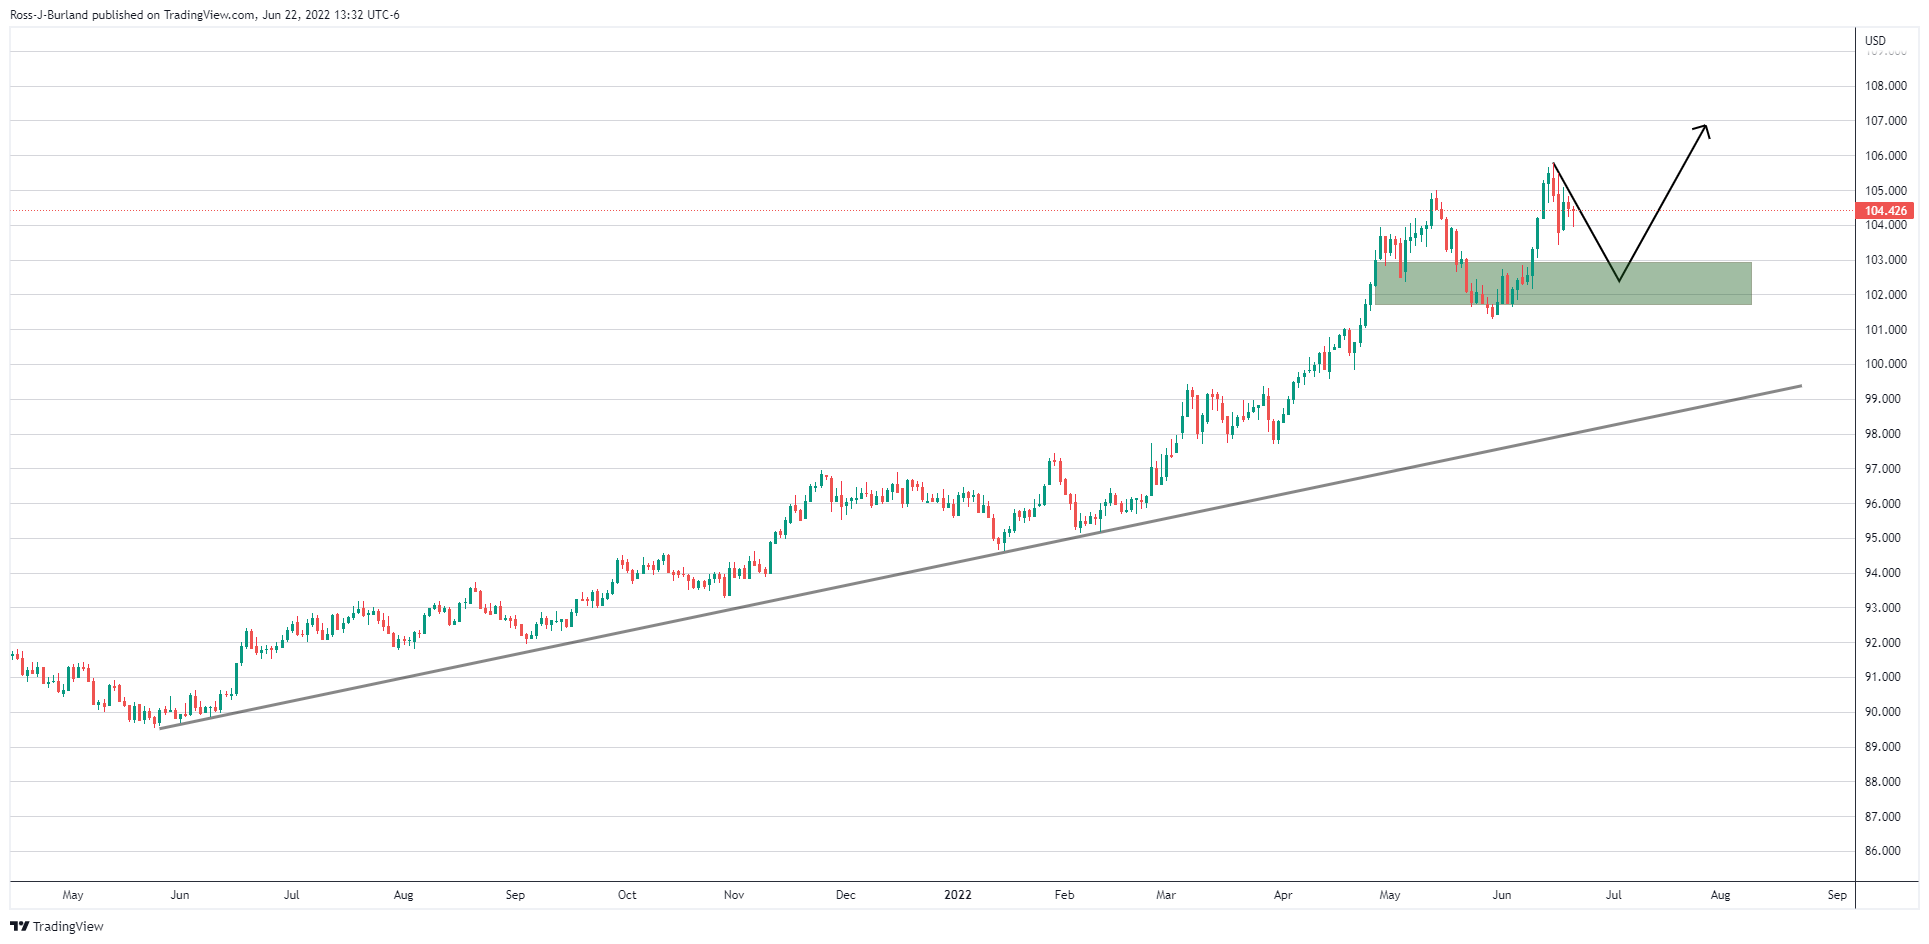
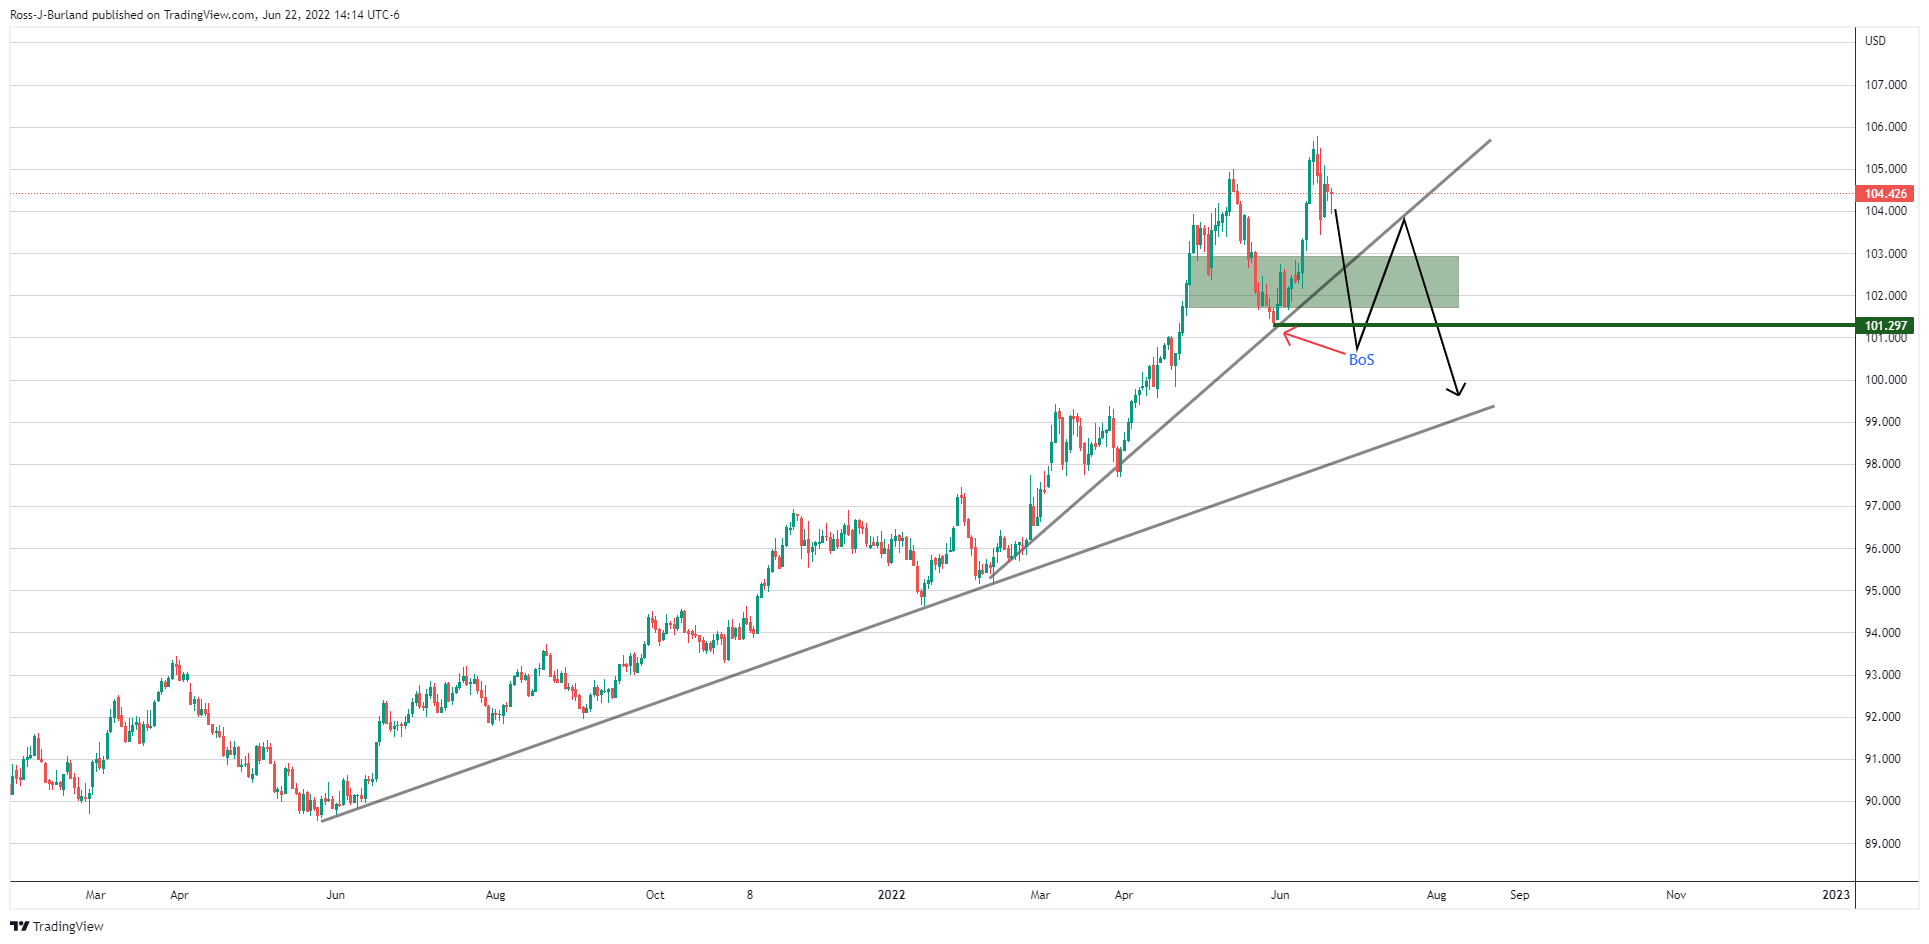
Meanwhile, however, from a daily perspective, the price remains in a bullish uptrend. The market structure is as follows:
The break of structure led to a higher high. What could be playing out is a mere run on liquidity across the various currencies supporting the index and the US dollar, aka, a healthy correction in the forex market. In the DXY index, there has already been a 61.8% Fibo correction to 103.33 and a touch below where the price rallied.
However, given the breakdown of the short-term market structure, as illustrated above, then this leaves the price imbalance just below 103 vulnerable. Below there, we have a demand area's mid point located at 102.3904, another at 101.9889 and then finally 101.336.
DXY bullish
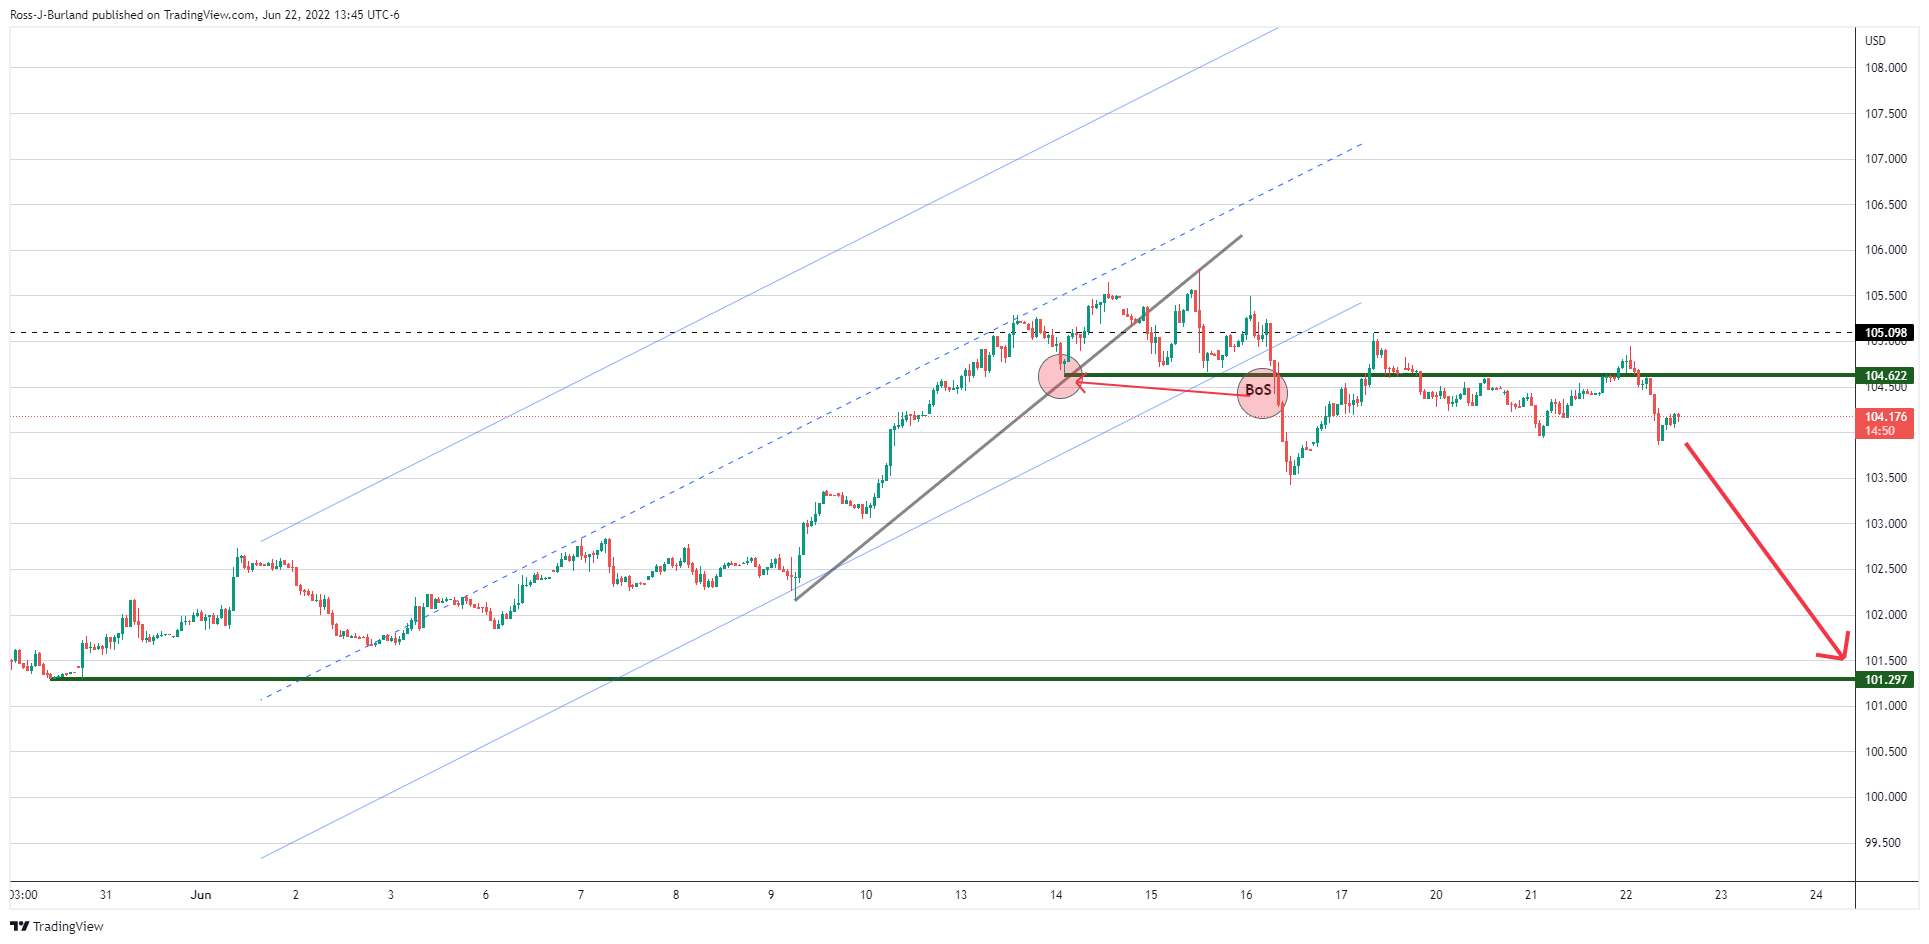
In any scenario, the bias remains bullish on the daily chart until a break of downside structure, or 101.297, as follows:


© 2000-2026. Bản quyền Teletrade.
Trang web này được quản lý bởi Teletrade D.J. LLC 2351 LLC 2022 (Euro House, Richmond Hill Road, Kingstown, VC0100, St. Vincent and the Grenadines).
Thông tin trên trang web không phải là cơ sở để đưa ra quyết định đầu tư và chỉ được cung cấp cho mục đích làm quen.
Giao dịch trên thị trường tài chính (đặc biệt là giao dịch sử dụng các công cụ biên) mở ra những cơ hội lớn và tạo điều kiện cho các nhà đầu tư sẵn sàng mạo hiểm để thu lợi nhuận, tuy nhiên nó mang trong mình nguy cơ rủi ro khá cao. Chính vì vậy trước khi tiến hành giao dịch cần phải xem xét mọi mặt vấn đề chấp nhận tiến hành giao dịch cụ thể xét theo quan điểm của nguồn lực tài chính sẵn có và mức độ am hiểu thị trường tài chính.
Sử dụng thông tin: sử dụng toàn bộ hay riêng biệt các dữ liệu trên trang web của công ty TeleTrade như một nguồn cung cấp thông tin nhất định. Việc sử dụng tư liệu từ trang web cần kèm theo liên kết đến trang teletrade.vn. Việc tự động thu thập số liệu cũng như thông tin từ trang web TeleTrade đều không được phép.
Xin vui lòng liên hệ với pr@teletrade.global nếu có câu hỏi.
ngân hàng