- Phân tích
- Tin tức và các công cụ
- Tin tức thị trường
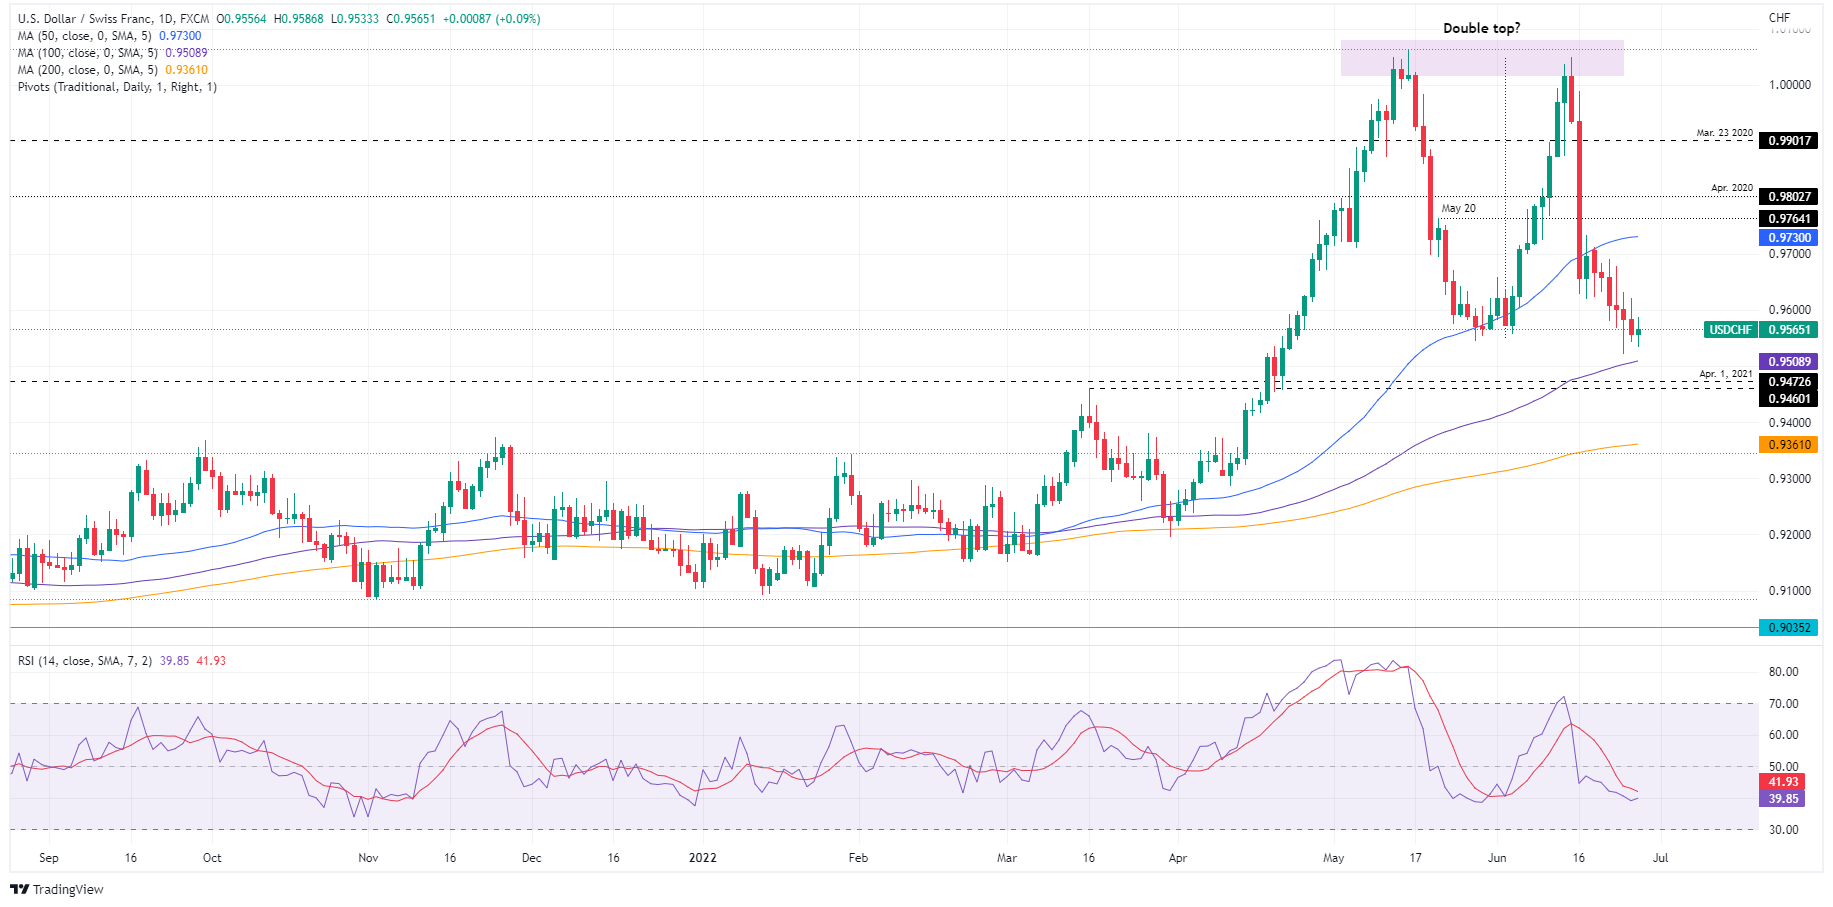
- USD/CHF Price Analysis: Double top in play but sellers failure at 0.9520, could spark a test of 0.9600
USD/CHF Price Analysis: Double top in play but sellers failure at 0.9520, could spark a test of 0.9600
- USD/CHF bounces off near-daily lows and stays above the 50% Fibonacci retracement in the H1 chart.
- Disappointing US economic data sparks a counter-cyclical move with the US dollar rising instead of falling.
- The USD/CHF daily chart formed a double top that is in play, but USD/CHF sellers’ failures to breach 0.9520, might open the door for a rally towards 0.9600.
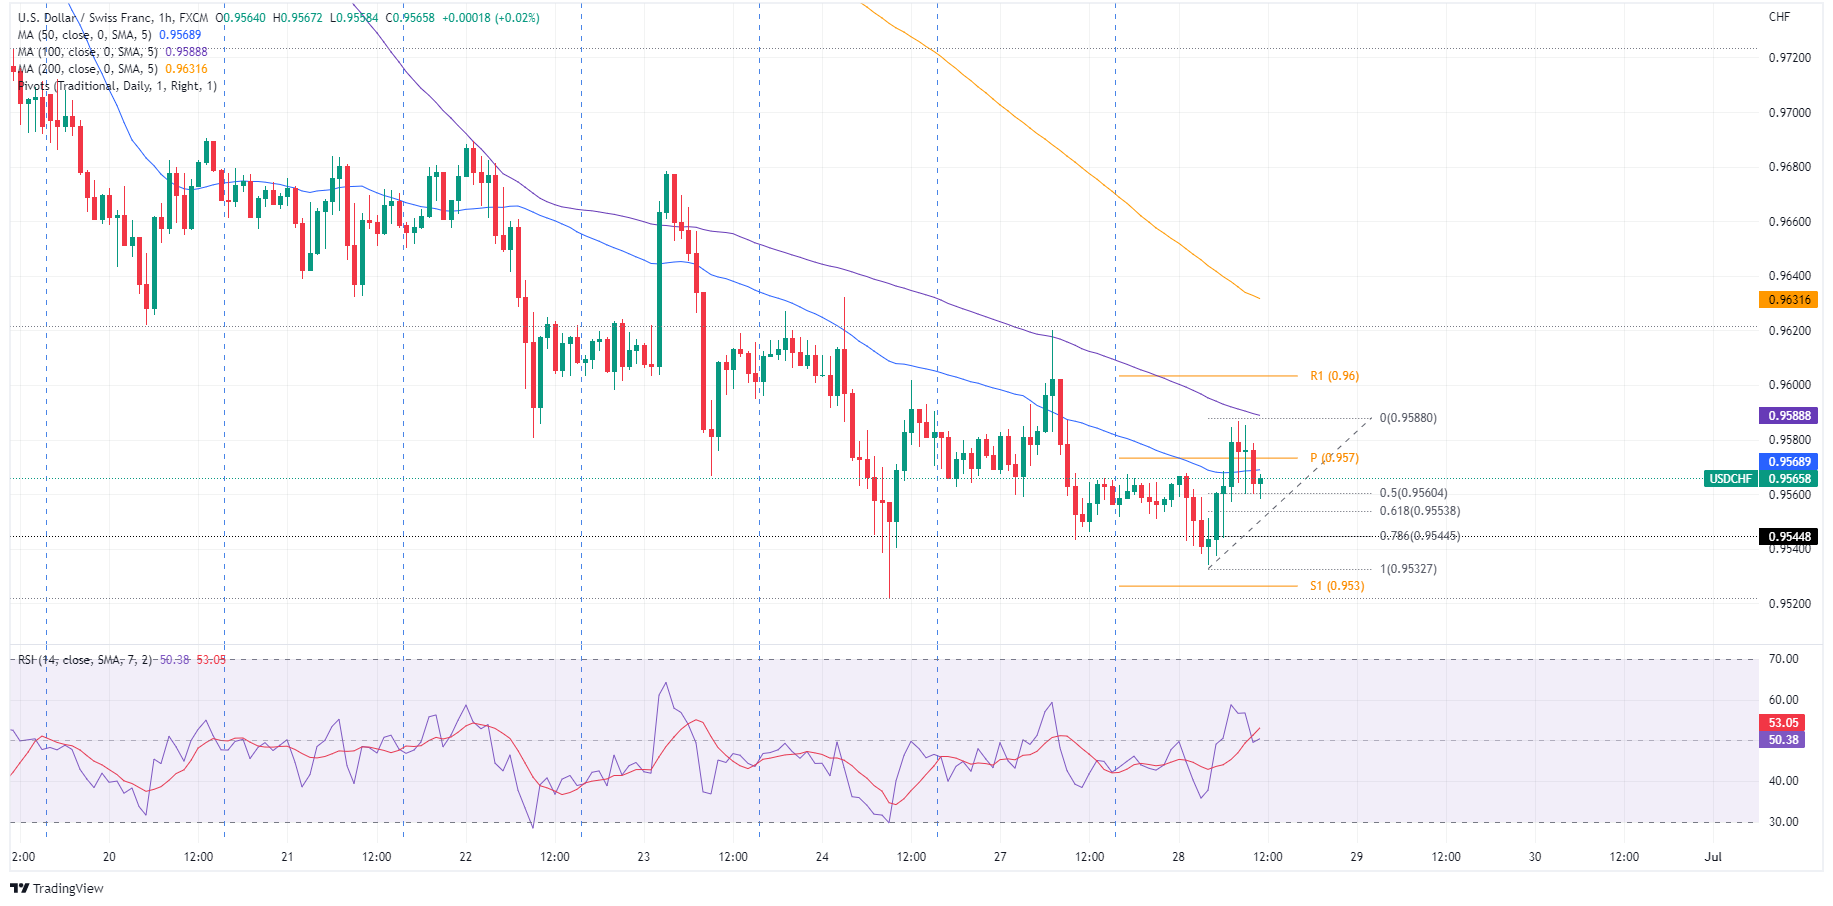
The USD/CHF is trying to stage a recovery after falling for six straight days, though it failed to break below the June 24 daily low of around 0.9561 and remains trapped within that day’s price action amidst the lack of a fresh impulse above/below the 0.9520-9630 range. At 0.9563, the USD/CHF advances barely by 0.07% in the North American session.
US equities are beginning to tumble as market sentiment shifted sour. During the Asian session, positive news from China that cut quarantine for travelers was overshadowed by a dismal read in US consumer confidence, triggering a counter-cyclical move in the greenback, with the US Dollar Index advancing sharply near last Friday’s high around 104.377, up by 0.42%.
USD/CHF traders should notice that negative US data from the growth perspective can sometimes boost the greenback, as is happening today.
USD/CHF Daily chart
A double top in the USD/CHF daily chart is still in play. However, since last Friday, CHF buyers could not achieve a fresh swing low, below the 0.9520-0.9630 range, keeping the major trapped. In the meantime, the Relative Strength Index (RSI) at 39.72 begins to show some signs of aiming slightly up, but unless it breaks the 50-midline, the bias remains negative, and the USD/CHF might probe the 100-day moving average (DMA) at 0.9508 in the near term.
USD/CHF 1-Hour chart
The USD/CHF is seesawing around the daily pivot near 0.9573, with the 50, 100, and 200-simple moving averages (SMAs) above the exchange rate. Nevertheless, the pullback from daily highs at around 0.9586 might be short-lived, as the price jumped from around the 50% Fibonacci retracement at 0.9560 after the London fix.
If the USD/CHF breaks above the 50-SMA at 0.9568, a re-test of the daily highs is on the cards. That said, the major next resistance would be the daily pivot at 0.9573, followed by the confluence of the 100-SMA, and the daily high near 0.9586-88, followed by the R1 daily pivot at 0.9600.
USD/CHF Key Technical Levels


© 2000-2026. Bản quyền Teletrade.
Trang web này được quản lý bởi Teletrade D.J. LLC 2351 LLC 2022 (Euro House, Richmond Hill Road, Kingstown, VC0100, St. Vincent and the Grenadines).
Thông tin trên trang web không phải là cơ sở để đưa ra quyết định đầu tư và chỉ được cung cấp cho mục đích làm quen.
Giao dịch trên thị trường tài chính (đặc biệt là giao dịch sử dụng các công cụ biên) mở ra những cơ hội lớn và tạo điều kiện cho các nhà đầu tư sẵn sàng mạo hiểm để thu lợi nhuận, tuy nhiên nó mang trong mình nguy cơ rủi ro khá cao. Chính vì vậy trước khi tiến hành giao dịch cần phải xem xét mọi mặt vấn đề chấp nhận tiến hành giao dịch cụ thể xét theo quan điểm của nguồn lực tài chính sẵn có và mức độ am hiểu thị trường tài chính.
Sử dụng thông tin: sử dụng toàn bộ hay riêng biệt các dữ liệu trên trang web của công ty TeleTrade như một nguồn cung cấp thông tin nhất định. Việc sử dụng tư liệu từ trang web cần kèm theo liên kết đến trang teletrade.vn. Việc tự động thu thập số liệu cũng như thông tin từ trang web TeleTrade đều không được phép.
Xin vui lòng liên hệ với pr@teletrade.global nếu có câu hỏi.
ngân hàng