- Phân tích
- Tin tức và các công cụ
- Tin tức thị trường
- USD/JPY Price Analysis: A lurking rising wedge could open the door towards 132.00
USD/JPY Price Analysis: A lurking rising wedge could open the door towards 132.00
- The USD/JPY extends its weekly gains to 0.74% on Tuesday.
- Falling US Treasury yields capped any U¨SD/JPY’s attempts towards the YTD highs near 136.70s.
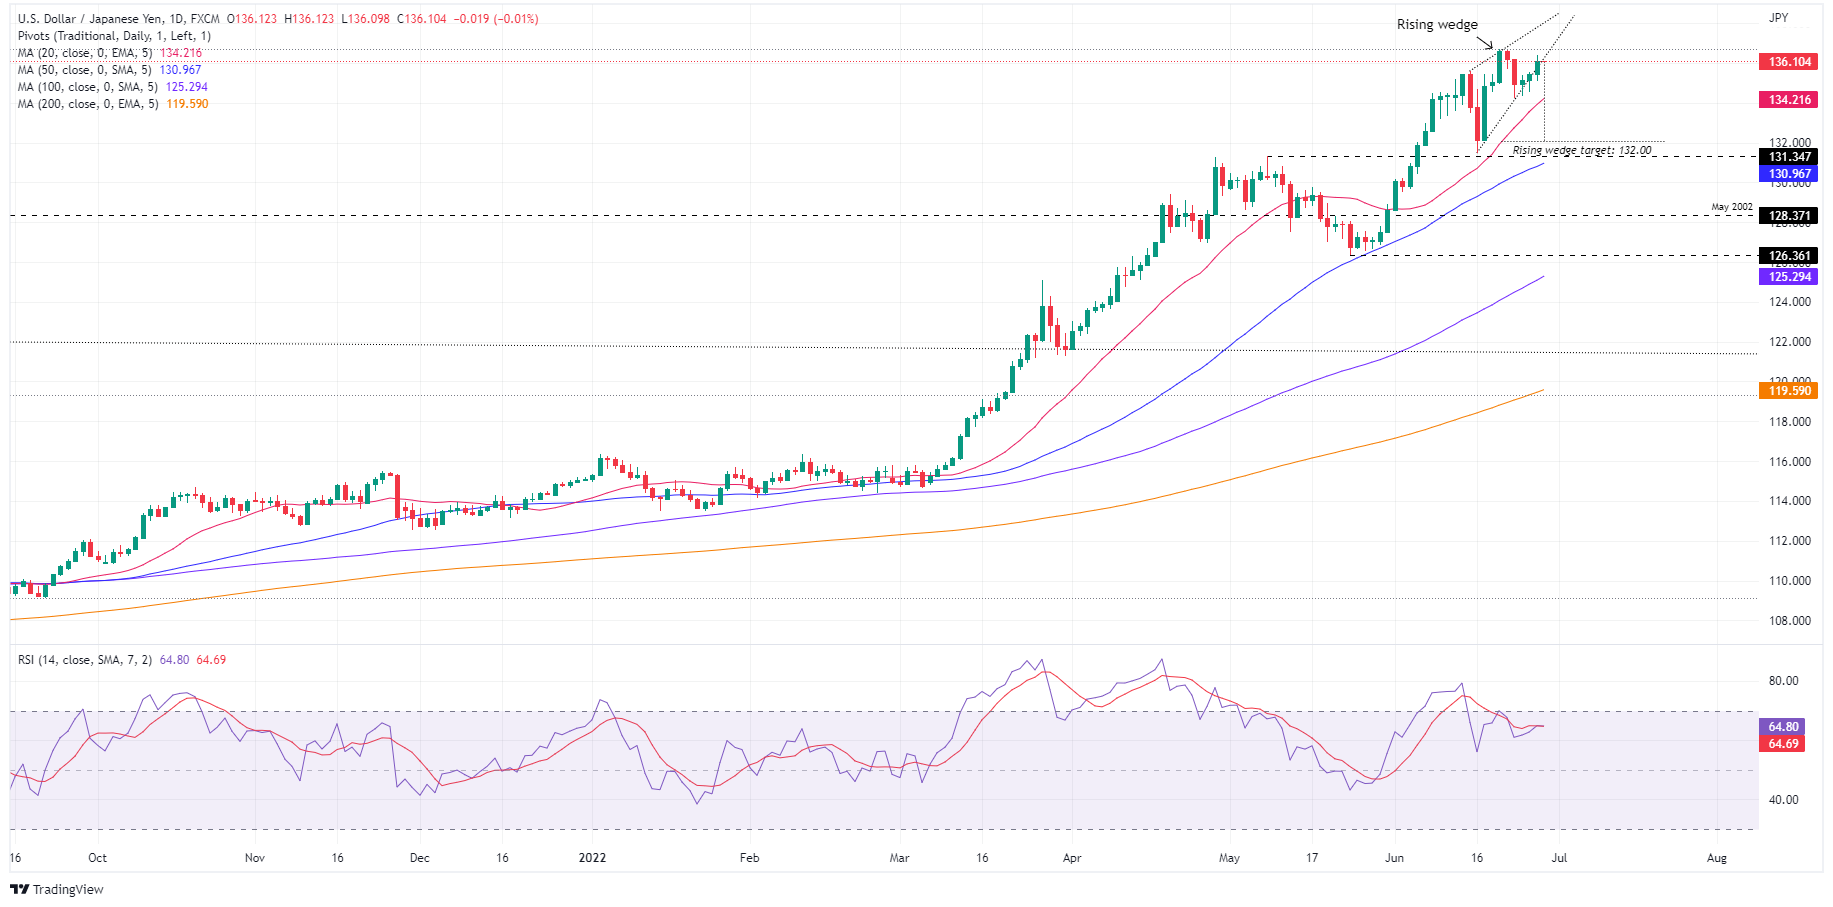
- A rising wedge in the USD/JPY daily chart looms; if it plays out, it will send the pair tumbling towards 132.00.
The USD/JPY extends its string of days, advancing to three straight, and registers a new weekly high near the 136.30s after bouncing from daily lows at around 135.10s earlier in the Asian session, gaining close to 80 pips in the day. At the time of writing, the USD/JPY is trading at 136.10.
Wall Street’s Tuesday session ended with substantial losses, between 1.56% and 3.09%. A risk-off mood impulse, usually a headwind for the major, backfired on the Japanese yen, which remains heavy on the Bank of Japan’s (BoJ) pledging for an ultra-loose monetary policy stance, despite dealing with a weaker JPY, which makes inflation less tolerable.
In the meantime, US Treasury yields receded from weekly highs. The US 10-year benchmark note rate edges down one basis point and sits at 3.183%, putting a lid on higher USD/JPY prices.
USD/JPY Daily chart
The USD/JPY is still upward biased, albeit closing to YTD highs and “verbal” intervention by Japanese authorities. However, price action begins to show the possible formation of a rising wedge, which would pave the way for a pullback. If that scenario plays out, the USD/JPY first target would be the 20-EMA at 133.92, followed by the June 16 swing low at 131.49. USD/JPY traders should be aware that once the latter’s cleared, the 50-EMA at around 130.80 would be in play.
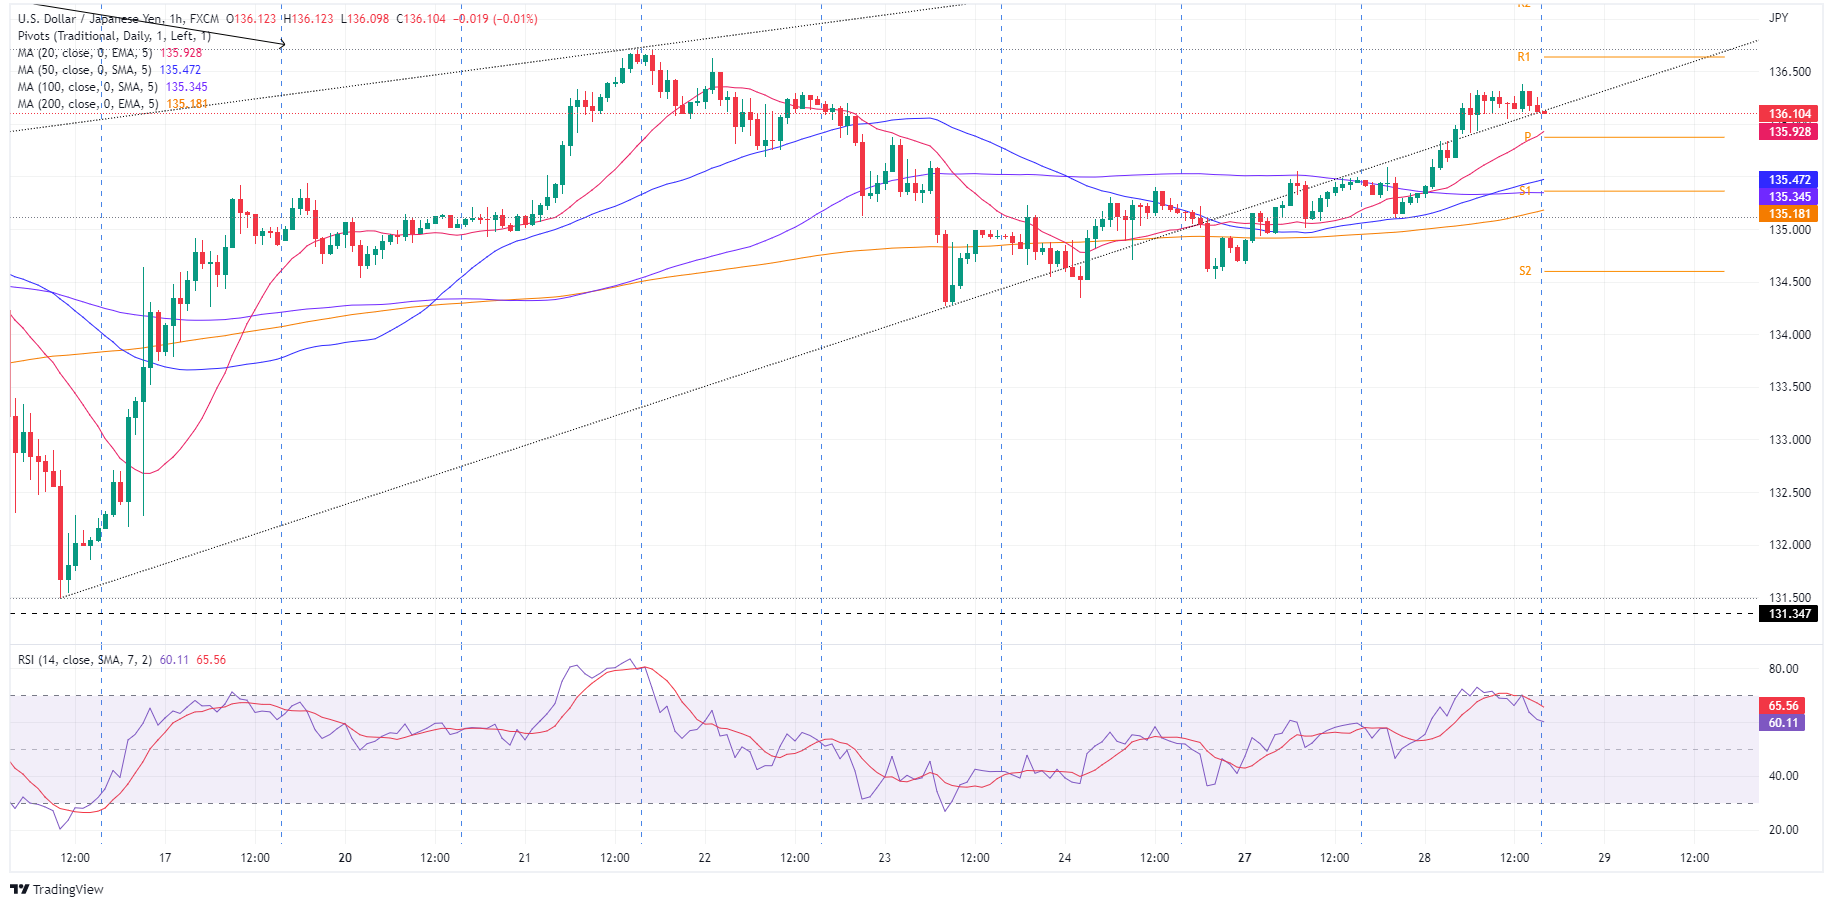
USD/JPY Hourly chart
The USD/JPY consolidates around the 135.00-136.20 area, clinging to Tuesday’s R2 daily pivot at 136.21. Traders should notice that the Relative Strength Index (RSI), albeit at 63.26, is aiming lower and trending below RSI’s 7-period SMA, a bearish signal suggesting downward pressure lying ahead.
USD/JPY buyers’ failure to break above 136.21 might open the door for further losses. That said, the major’s first support would be 136.00. Break below would expose the 20-EMA at 135.88, followed by the confluence of the 50 and 100-EMA around 135.45-34, respectively, and then the 200-EMA at 135.16.
Conversely, a USD/JPY’s upward break above 136.21 might open the door for a YTD test at 136.71.
USD/JPY Key Technical Levels


© 2000-2026. Bản quyền Teletrade.
Trang web này được quản lý bởi Teletrade D.J. LLC 2351 LLC 2022 (Euro House, Richmond Hill Road, Kingstown, VC0100, St. Vincent and the Grenadines).
Thông tin trên trang web không phải là cơ sở để đưa ra quyết định đầu tư và chỉ được cung cấp cho mục đích làm quen.
Giao dịch trên thị trường tài chính (đặc biệt là giao dịch sử dụng các công cụ biên) mở ra những cơ hội lớn và tạo điều kiện cho các nhà đầu tư sẵn sàng mạo hiểm để thu lợi nhuận, tuy nhiên nó mang trong mình nguy cơ rủi ro khá cao. Chính vì vậy trước khi tiến hành giao dịch cần phải xem xét mọi mặt vấn đề chấp nhận tiến hành giao dịch cụ thể xét theo quan điểm của nguồn lực tài chính sẵn có và mức độ am hiểu thị trường tài chính.
Sử dụng thông tin: sử dụng toàn bộ hay riêng biệt các dữ liệu trên trang web của công ty TeleTrade như một nguồn cung cấp thông tin nhất định. Việc sử dụng tư liệu từ trang web cần kèm theo liên kết đến trang teletrade.vn. Việc tự động thu thập số liệu cũng như thông tin từ trang web TeleTrade đều không được phép.
Xin vui lòng liên hệ với pr@teletrade.global nếu có câu hỏi.
ngân hàng