- Phân tích
- Tin tức và các công cụ
- Tin tức thị trường
- Gold Price Forecast: XAUUSD eyes $1,798 and $1,794 as next downside targets – Confluence Detector
Gold Price Forecast: XAUUSD eyes $1,798 and $1,794 as next downside targets – Confluence Detector
- Gold Price returns to the red zone despite weaker US Treasury yields.
- Markets remain cautious ahead of the Fed Minutes and an impending death cross.
- XAUUSD could resume sell-off below $1,800 amid light trading conditions.
Gold Price is resuming its downside momentum at the start of a fresh week, having witnessed an impressive rebound on Friday. The US dollar is consolidating the minor rebound amid the renewed downtick in the Treasury yields and falling S&P 500 futures. The mixed market mood and holiday-thinned trading have kept gold bulls at bay. A death cross lurking on the daily chart is offering the much-needed boost to XAUUSD sellers. Attention now turns towards Wednesday’s FOMC June meeting’s minutes for the next price direction in the bright metal. In the meantime, the Fed rate hike expectations and recession fears will continue to dominate markets and influence the dynamics of the bullion price.
Also read: Gold Price Forecast: Death cross to ring knell for XAUUSD, as eyes turn to Fed Minutes
Gold Price: Key levels to watch
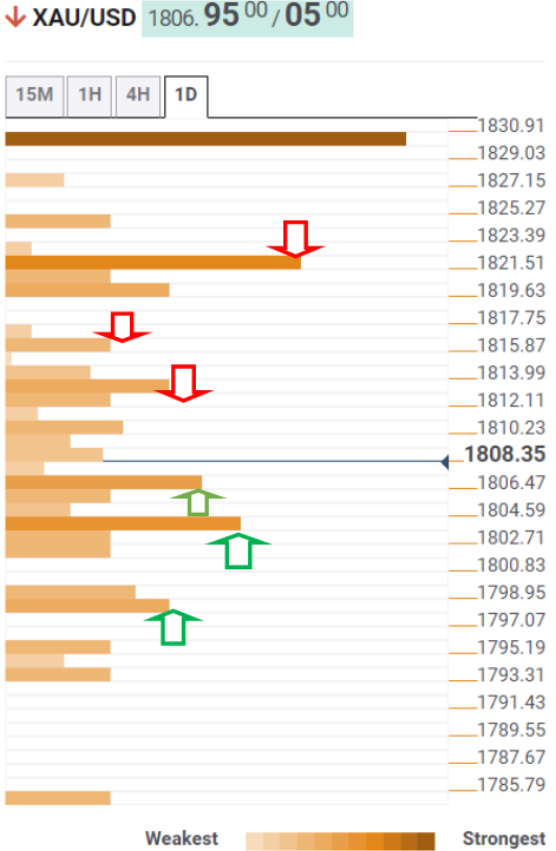
The Technical Confluence Detector shows that Gold Price is testing support at the Fibonacci 38.2% one-week at $1,806, below which the next downside target is aligned at the previous month’s low of $1,803.
The confluence support of the Fibonacci 23.6% one-week and Bollinger Band one-day Lower at $1,798 will then come to XAU buyers’ rescue. The last line of defense for gold bulls is seen around $1,794, the convergence of the Fibonacci 61.8% one-day and the pivot point one-day S1.
On the flip side, Friday’s high of $1,812 will lure byers, above which they will need to recapture the SMA5 one-day at $1,816. The intersection of the Fibonacci 23.6% one-month, SMA50 four-hour and the pivot point one-day R1 at $1,820 will be a tough nut to crack for bulls.
Here is how it looks on the tool
About Technical Confluences Detector
The TCD (Technical Confluences Detector) is a tool to locate and point out those price levels where there is a congestion of indicators, moving averages, Fibonacci levels, Pivot Points, etc. If you are a short-term trader, you will find entry points for counter-trend strategies and hunt a few points at a time. If you are a medium-to-long-term trader, this tool will allow you to know in advance the price levels where a medium-to-long-term trend may stop and rest, where to unwind positions, or where to increase your position size.


© 2000-2026. Bản quyền Teletrade.
Trang web này được quản lý bởi Teletrade D.J. LLC 2351 LLC 2022 (Euro House, Richmond Hill Road, Kingstown, VC0100, St. Vincent and the Grenadines).
Thông tin trên trang web không phải là cơ sở để đưa ra quyết định đầu tư và chỉ được cung cấp cho mục đích làm quen.
Giao dịch trên thị trường tài chính (đặc biệt là giao dịch sử dụng các công cụ biên) mở ra những cơ hội lớn và tạo điều kiện cho các nhà đầu tư sẵn sàng mạo hiểm để thu lợi nhuận, tuy nhiên nó mang trong mình nguy cơ rủi ro khá cao. Chính vì vậy trước khi tiến hành giao dịch cần phải xem xét mọi mặt vấn đề chấp nhận tiến hành giao dịch cụ thể xét theo quan điểm của nguồn lực tài chính sẵn có và mức độ am hiểu thị trường tài chính.
Sử dụng thông tin: sử dụng toàn bộ hay riêng biệt các dữ liệu trên trang web của công ty TeleTrade như một nguồn cung cấp thông tin nhất định. Việc sử dụng tư liệu từ trang web cần kèm theo liên kết đến trang teletrade.vn. Việc tự động thu thập số liệu cũng như thông tin từ trang web TeleTrade đều không được phép.
Xin vui lòng liên hệ với pr@teletrade.global nếu có câu hỏi.
ngân hàng