- Phân tích
- Tin tức và các công cụ
- Tin tức thị trường
- Gold Price Forecast: XAUUSD bears retain control near YTD low – Confluence Detector
Gold Price Forecast: XAUUSD bears retain control near YTD low – Confluence Detector
- Gold Price turned lower for the third straight day and refreshed YTD low on Wednesday.
- The USD gained strong follow-through traction and continued weighing on the commodity.
- Recession fears failed to lend support, though losses remain limited ahead of FOMC minutes.
Gold Price met with a fresh supply near the $1,773 region on Wednesday and drifted in negative territory for the third successive day. The intraday decline dragged the XAUUSD to a fresh YTD low, around the $1,760-$1,759 area during the early North American session and was sponsored by strong follow-through US dollar buying. In fact, the USD Index built on the previous day's blowout rally and surged to a fresh two-decade high amid aggressive Fed rate hike bets, which, in turn, undermined the dollar-denominated commodity. Bulls, so far, have failed to gain any respite from the prevalent risk-off environment, which tends to benefit the safe-haven precious metal. This, in turn, suggests that the path of least resistance for the yellow metal is to the downside.
Gold Price: Key levels to watch
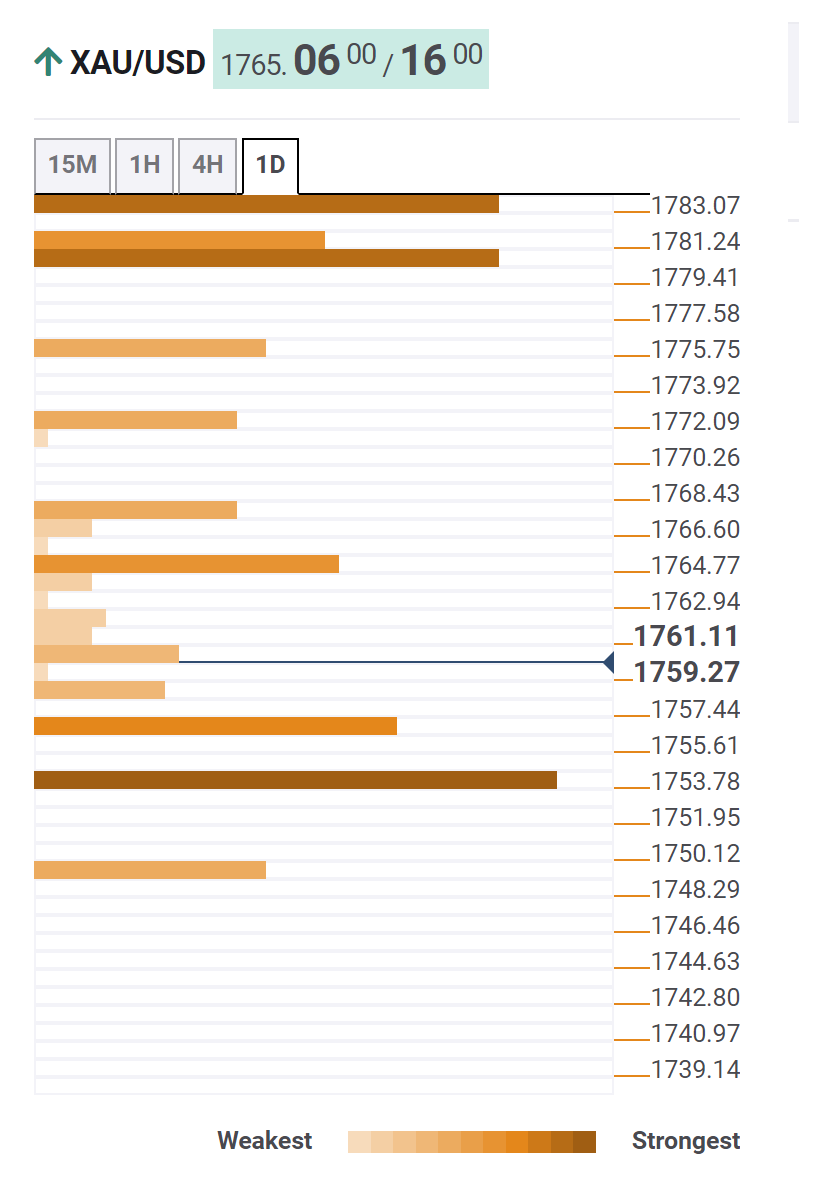
The Technical Confluence Detector shows that the next relevant support for Gold Price is pegged near the $1,754-$1,753 region - Pivot Point One Month S2. This is closely followed by support near the $1,750 area - Pivot Point One Day S1. Failure to defend the said support levels would be seen as a fresh trigger for bearish traders and pave the way for a further near-term depreciating move.
On the flip side, the $1,765 region - the convergence of Previous Low One Day, Bollinger Band 15 Minutes Middle and SMA 5 One Hour - now seems to act as immediate resistance. Sustained strength beyond could trigger a short-covering move and lift Gold Price to the $1,780-$1,783 region - Pivot Point One Month S1, Bollinger Band One Day Lower and the Fibonacci 38.2% One Day.
Here is how it looks on the tool
About Technical Confluences Detector
The TCD (Technical Confluences Detector) is a tool to locate and point out those price levels where there is a congestion of indicators, moving averages, Fibonacci levels, Pivot Points, etc. If you are a short-term trader, you will find entry points for counter-trend strategies and hunt a few points at a time. If you are a medium-to-long-term trader, this tool will allow you to know in advance the price levels where a medium-to-long-term trend may stop and rest, where to unwind positions, or where to increase your position size.


© 2000-2026. Bản quyền Teletrade.
Trang web này được quản lý bởi Teletrade D.J. LLC 2351 LLC 2022 (Euro House, Richmond Hill Road, Kingstown, VC0100, St. Vincent and the Grenadines).
Thông tin trên trang web không phải là cơ sở để đưa ra quyết định đầu tư và chỉ được cung cấp cho mục đích làm quen.
Giao dịch trên thị trường tài chính (đặc biệt là giao dịch sử dụng các công cụ biên) mở ra những cơ hội lớn và tạo điều kiện cho các nhà đầu tư sẵn sàng mạo hiểm để thu lợi nhuận, tuy nhiên nó mang trong mình nguy cơ rủi ro khá cao. Chính vì vậy trước khi tiến hành giao dịch cần phải xem xét mọi mặt vấn đề chấp nhận tiến hành giao dịch cụ thể xét theo quan điểm của nguồn lực tài chính sẵn có và mức độ am hiểu thị trường tài chính.
Sử dụng thông tin: sử dụng toàn bộ hay riêng biệt các dữ liệu trên trang web của công ty TeleTrade như một nguồn cung cấp thông tin nhất định. Việc sử dụng tư liệu từ trang web cần kèm theo liên kết đến trang teletrade.vn. Việc tự động thu thập số liệu cũng như thông tin từ trang web TeleTrade đều không được phép.
Xin vui lòng liên hệ với pr@teletrade.global nếu có câu hỏi.
ngân hàng