- Phân tích
- Tin tức và các công cụ
- Tin tức thị trường
- USD/CHF Price Analysis: Climbs near 0.9800 on broad US dollar strength, risk aversion
USD/CHF Price Analysis: Climbs near 0.9800 on broad US dollar strength, risk aversion
- The USD/CHF is upward biased, but the change of posture of the Swiss National Bank (SNB) from dovish to hawkish could cap USD/CHF rallies toward the YTD high.
- USD/CHF Price Analysis: The daily and 1-hour charts illustrate an upward bias in the pair, so any pullbacks are better opportunities for buyers to step in.
The USD/CHF advances firmly on Monday amidst traders’ risk-off sentiment, which bolstered the greenback. However, last month’s Swiss National Bank (SNB) sudden shift towards a hawkish posture put a lid on the USD/CHF climb, retreating from daily highs around 0.9840.
The USD/CHF is trading around the 0.9790s region and remains positive in the day, up by 0.33% amidst a risk-aversion trading day.
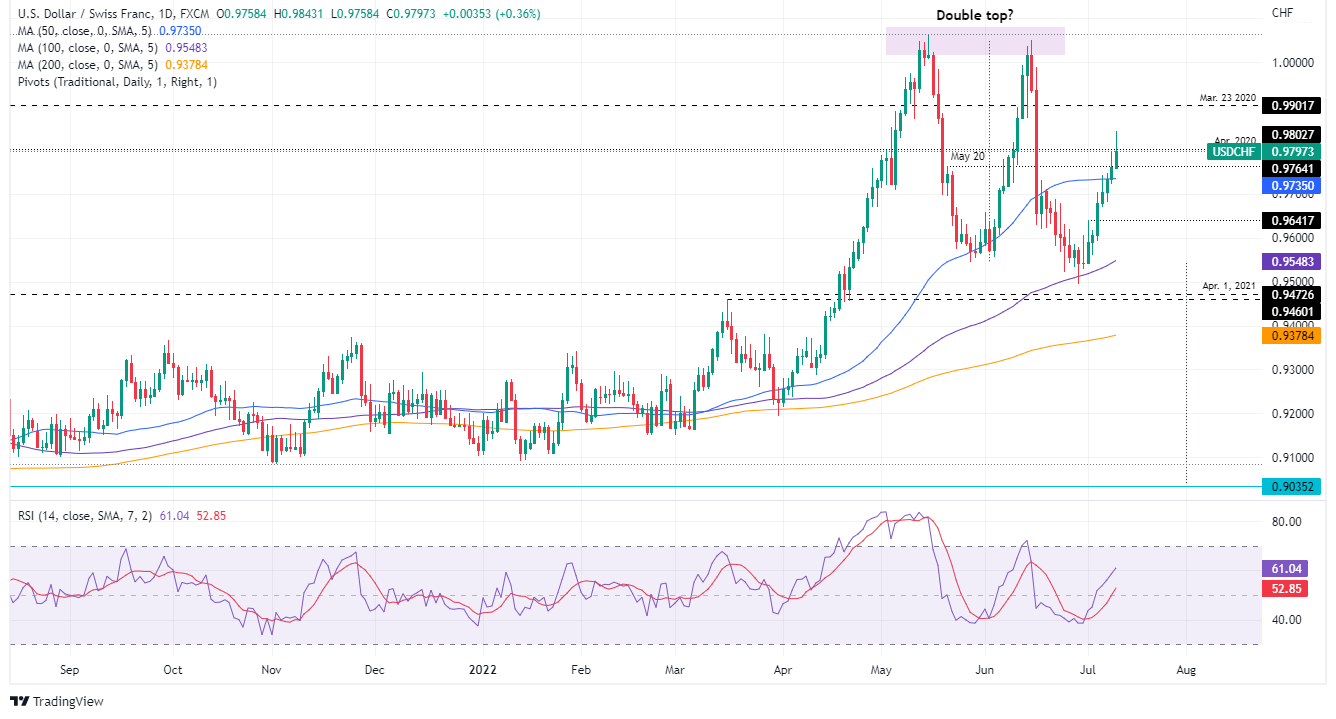
USD/CHF Daily chart
The USD/CHF is still in an uptrend, as depicted by the daily chart. However, some selling pressure emerged between the 0.9800-0.9900 range, dragging prices lower, below last Friday’s daily high at 0.9797. Oscillators remain in bullish territory, like the Relative Strength Index (RSI) at 60.67, with room to spare before reaching overbought conditions. Therefore, the USD/CHF path of least resistance will continue upwards.
That said, the USD/CHF first resistance will be 0.9800. A breach of the latter will send the major towards July 11 high at 0.9843, followed by May 23, 2020, daily high at 0.9901.
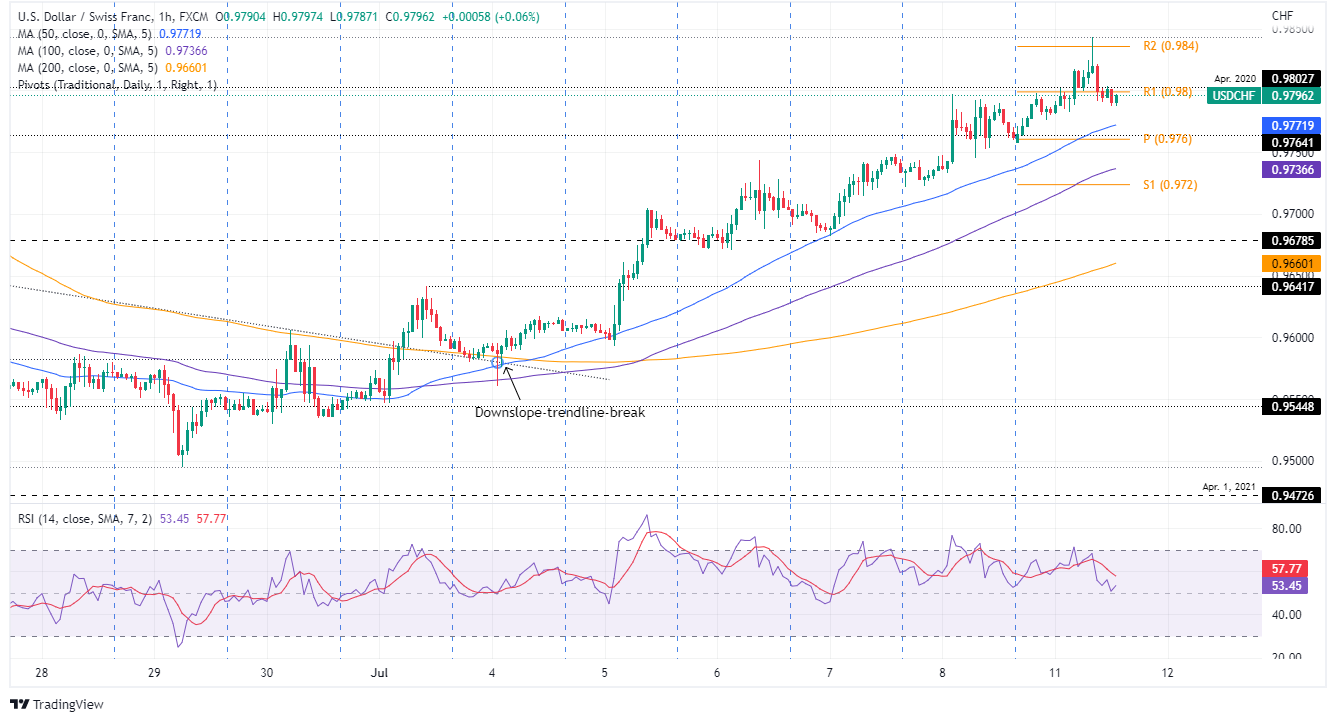
USD/CHF 1-Hour chart
The USD/CHF shows an upward trajectory, aligned with the USD/CHF higher time-frame (HT), being the daily chart. Nevertheless, the rally stalled around the R2 daily pivot, and subsequent pullbacks should be bought, as the major would continue to the upside. USD/CHF traders should be aware that the Relative Strenght Index (RSI) in this time frame, as the pair rallies and retraces, the RSI’s has been seesawing within the 50-70 boundaries without reaching overbought conditions, meaning the uptrend is solid.
Hence, the USD/CHF first resistance would be the R1 pivot point at 0.9800. The break above would expose the R2 daily pivot at 0.9835, followed by the daily high around 0.9843.
USD/CHF Key Technical Levels


© 2000-2026. Bản quyền Teletrade.
Trang web này được quản lý bởi Teletrade D.J. LLC 2351 LLC 2022 (Euro House, Richmond Hill Road, Kingstown, VC0100, St. Vincent and the Grenadines).
Thông tin trên trang web không phải là cơ sở để đưa ra quyết định đầu tư và chỉ được cung cấp cho mục đích làm quen.
Giao dịch trên thị trường tài chính (đặc biệt là giao dịch sử dụng các công cụ biên) mở ra những cơ hội lớn và tạo điều kiện cho các nhà đầu tư sẵn sàng mạo hiểm để thu lợi nhuận, tuy nhiên nó mang trong mình nguy cơ rủi ro khá cao. Chính vì vậy trước khi tiến hành giao dịch cần phải xem xét mọi mặt vấn đề chấp nhận tiến hành giao dịch cụ thể xét theo quan điểm của nguồn lực tài chính sẵn có và mức độ am hiểu thị trường tài chính.
Sử dụng thông tin: sử dụng toàn bộ hay riêng biệt các dữ liệu trên trang web của công ty TeleTrade như một nguồn cung cấp thông tin nhất định. Việc sử dụng tư liệu từ trang web cần kèm theo liên kết đến trang teletrade.vn. Việc tự động thu thập số liệu cũng như thông tin từ trang web TeleTrade đều không được phép.
Xin vui lòng liên hệ với pr@teletrade.global nếu có câu hỏi.
ngân hàng