- Phân tích
- Tin tức và các công cụ
- Tin tức thị trường
- Gold Price Forecast: XAUUSD readies for a rebound towards $1,722 – Confluence Detector
Gold Price Forecast: XAUUSD readies for a rebound towards $1,722 – Confluence Detector
- Gold Price struggles around YTD low as hawkish Fed bets, recession fears ebb.
- US dollar bulls take a breather at a multi-year high as traders await important consumer-centric data.
- XAUUSD appears lucrative for short-term buying until staying beyond $1,705.
Gold Price (XAUUSD) stays defensive at around $1,700, consolidating recent losses near the lowest levels in 11 months as risk-aversion fades ahead of the key US data. Also contributing to the corrective pullback could be the reduction in the hawkish Fed bets and easing the inversion gap of the key US Treasury yield curves, namely between 2-year and 10-year bonds. It’s worth noting, however, that the firmer US Producer Price Index (PPI) and downbeat economics from China keep gold sellers hopeful as they await US Retail Sales for June and preliminary readings of the Michigan Consumer Sentiment Index (CSI) for July.
Also read: Gold Price aims to recapture $1,700 as DXY hopes for a rebound, US Michigan CSI eyed
Gold Price: Key levels to watch
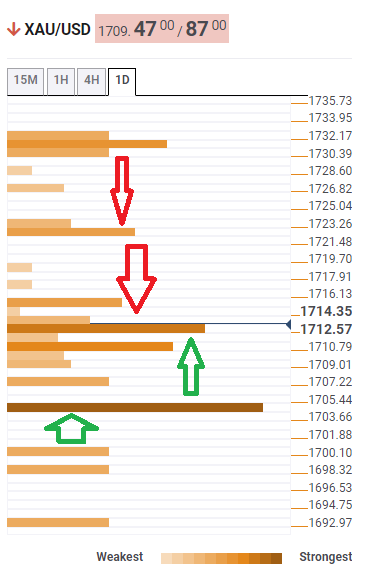
The Technical Confluence Detector shows that Gold Price is in its nascent stage of recovery as it recently crossed the $1,713 hurdle comprising the previous hour on four-hour and Fibonacci 38.2% on one-day.
Also keeping the XAUUSD buyers hopeful is the metal sustained trading beyond the key resistance-turned-support around $1,705, including Pivot Point S3 one-month and lower band of the Bollinger on one-hour.
It’s worth noting that the gold seller’s dominance past $1,705 needs validation from the $1,700 threshold that coincides lower band of the Bollinger on one-day, as well as the previous daily bottom.
That said, the gold buyers are all set to poke the $1,724 resistance mark where Fibonacci 61.8% one-day joins 50-HMA and SMA-10 in four-hour.
Should the metal prices remain firmer past $1,724, the odds of witnessing a run-up towards $1,732, including the previous weekly low and Pivot Point R1 on one-day, can’t be ruled out.
Overall, Gold Price lures intraday buyers but the bearish trend is yet to be rejected.
Here is how it looks on the tool
About Technical Confluences Detector
The TCD (Technical Confluences Detector) is a tool to locate and point out those price levels where there is a congestion of indicators, moving averages, Fibonacci levels, Pivot Points, etc. If you are a short-term trader, you will find entry points for counter-trend strategies and hunt a few points at a time. If you are a medium-to-long-term trader, this tool will allow you to know in advance the price levels where a medium-to-long-term trend may stop and rest, where to unwind positions, or where to increase your position size.


© 2000-2026. Bản quyền Teletrade.
Trang web này được quản lý bởi Teletrade D.J. LLC 2351 LLC 2022 (Euro House, Richmond Hill Road, Kingstown, VC0100, St. Vincent and the Grenadines).
Thông tin trên trang web không phải là cơ sở để đưa ra quyết định đầu tư và chỉ được cung cấp cho mục đích làm quen.
Giao dịch trên thị trường tài chính (đặc biệt là giao dịch sử dụng các công cụ biên) mở ra những cơ hội lớn và tạo điều kiện cho các nhà đầu tư sẵn sàng mạo hiểm để thu lợi nhuận, tuy nhiên nó mang trong mình nguy cơ rủi ro khá cao. Chính vì vậy trước khi tiến hành giao dịch cần phải xem xét mọi mặt vấn đề chấp nhận tiến hành giao dịch cụ thể xét theo quan điểm của nguồn lực tài chính sẵn có và mức độ am hiểu thị trường tài chính.
Sử dụng thông tin: sử dụng toàn bộ hay riêng biệt các dữ liệu trên trang web của công ty TeleTrade như một nguồn cung cấp thông tin nhất định. Việc sử dụng tư liệu từ trang web cần kèm theo liên kết đến trang teletrade.vn. Việc tự động thu thập số liệu cũng như thông tin từ trang web TeleTrade đều không được phép.
Xin vui lòng liên hệ với pr@teletrade.global nếu có câu hỏi.
ngân hàng