- Phân tích
- Tin tức và các công cụ
- Tin tức thị trường
- Gold Price Forecast: XAUUSD eyes $1,728 and $1,730 on the road to recovery – Confluence Detector
Gold Price Forecast: XAUUSD eyes $1,728 and $1,730 on the road to recovery – Confluence Detector
- Gold Price holds the recovery from 11-month highs, as the US dollar corrects further.
- US Treasury yields tick higher amid risk flows, light economic calendar.
- XAUUSD sees more upside amid easing aggressive Fed tightening expectations.
Gold Price has staged an impressive bounce from near 11-month lows of $1,698, as the US dollar is on an extending corrective decline amid a risk-on market profile and easing fears over aggressive Fed tightening expectations. Markets are back to pricing a 75 bps July Fed rate hike after Friday’s UoM Inflation expectations gauge dipped to 2.8%. A less aggressive Fed rate hike path could help the US economy skirt a recession. Meanwhile, China announced policy measures to support the property sector as well as to stimulate economic growth. Investors continue to cheer a better market mood, adding to the pain in the safe-haven dollar. XAUUSD price will remain at the mercy of the broader market sentiment amid the Fed’s ‘blackout” period.
Also read: Gold Price Forecast: XAUUSD could face stiff resistance at $1,730 on the renewed upside
Gold Price: Key levels to watch
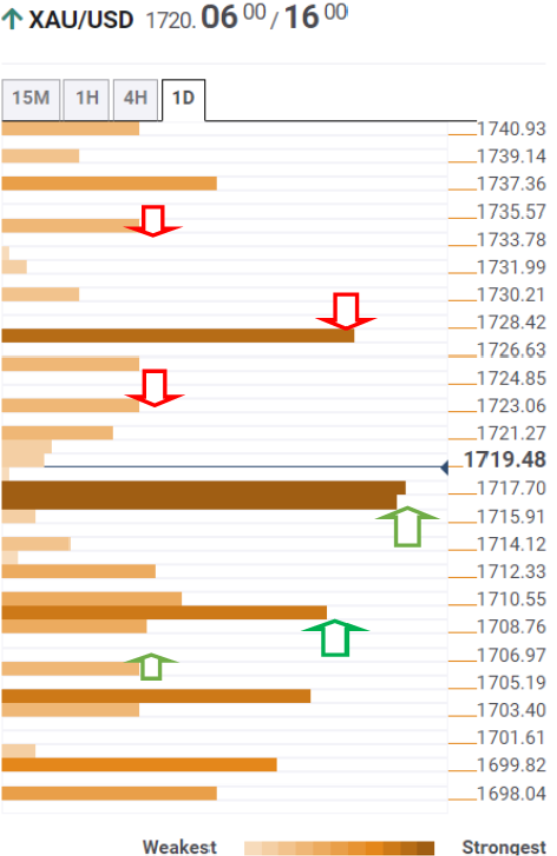
The Technical Confluence Detector shows that Gold Price sees the immediate upside barrier at the SMA 5 one-day at $1,723, above which the pivot point one-day R2 at $1,725 will get tested.
Buyers need acceptance above the convergence of the Fibonacci 161.8% one-day and Fibonacci 61.8% one-week at $1,728. The pivot point one-day R3 at $1,734 will be the last line of defense for XAU sellers.
Alternatively, a sustained move below the powerful cluster of support levels around $1,716 will fizzle out the recovery momentum. That level is the confluence of the previous day’s high, Fibonacci 38.2% one-week and pivot point one-day R1.
The next support awaits at the intersection of the Fibonacci 23.6% one-week and the SMA10 four-hour. The Fibonacci 38.2% one-day at $1,706 will be next on the sellers’ radars.
Here is how it looks on the tool
About Technical Confluences Detector
The TCD (Technical Confluences Detector) is a tool to locate and point out those price levels where there is a congestion of indicators, moving averages, Fibonacci levels, Pivot Points, etc. If you are a short-term trader, you will find entry points for counter-trend strategies and hunt a few points at a time. If you are a medium-to-long-term trader, this tool will allow you to know in advance the price levels where a medium-to-long-term trend may stop and rest, where to unwind positions, or where to increase your position size.


© 2000-2026. Bản quyền Teletrade.
Trang web này được quản lý bởi Teletrade D.J. LLC 2351 LLC 2022 (Euro House, Richmond Hill Road, Kingstown, VC0100, St. Vincent and the Grenadines).
Thông tin trên trang web không phải là cơ sở để đưa ra quyết định đầu tư và chỉ được cung cấp cho mục đích làm quen.
Giao dịch trên thị trường tài chính (đặc biệt là giao dịch sử dụng các công cụ biên) mở ra những cơ hội lớn và tạo điều kiện cho các nhà đầu tư sẵn sàng mạo hiểm để thu lợi nhuận, tuy nhiên nó mang trong mình nguy cơ rủi ro khá cao. Chính vì vậy trước khi tiến hành giao dịch cần phải xem xét mọi mặt vấn đề chấp nhận tiến hành giao dịch cụ thể xét theo quan điểm của nguồn lực tài chính sẵn có và mức độ am hiểu thị trường tài chính.
Sử dụng thông tin: sử dụng toàn bộ hay riêng biệt các dữ liệu trên trang web của công ty TeleTrade như một nguồn cung cấp thông tin nhất định. Việc sử dụng tư liệu từ trang web cần kèm theo liên kết đến trang teletrade.vn. Việc tự động thu thập số liệu cũng như thông tin từ trang web TeleTrade đều không được phép.
Xin vui lòng liên hệ với pr@teletrade.global nếu có câu hỏi.
ngân hàng