- Phân tích
- Tin tức và các công cụ
- Tin tức thị trường
- EUR/USD Price Analysis: Range bound within 1.0100-1.0260 since July 22
EUR/USD Price Analysis: Range bound within 1.0100-1.0260 since July 22
- The EUR/USD is set to finish the week almost flat, gaining 0.05%.
- The shared currency daily chart is neutral-to-downwards, but the hourly is neutral-to-upwards.
- EUR/USD Price Analysis: A daily close above 1.0200 could pave the way towards 1.0300; otherwise, it might drop towards 1.0096.
The EUR/USD is trading at 1.0220, after hitting a daily high at 1.0254, but later tumbled towards the daily low at 1.0145 on elevated US inflation data. In June, the Personal Consumption Expenditures (PCE) rose by 6.8% YoY, fueling expectations of additional Federal Reserve rate hikes, despite the market's pricing in only 80 bps of tightening.
EUR/USD Price Analysis: Technical outlook
From a daily chart perspective, the EUR/USD remains neutral-to-downward biased, helped by the 20-day EMA lying below the exchange rate at 1.0167. Nevertheless, the EUR/USD, unable to capitalize on an upbeat market mood, and broad US dollar weakness, keeps the shared currency exposed to further selling pressure. If EUR/USD buyers want to shift the bias to neutral, they must reclaim the May 13 low-turned-resistance at 1.0348. Once cleared, a challenge of the 50-day EMA at 1.0423 is on the cards. On the other hand, if EUR/USD sellers achieve a daily close below 1.0200, that would pave the road towards 1.0096.
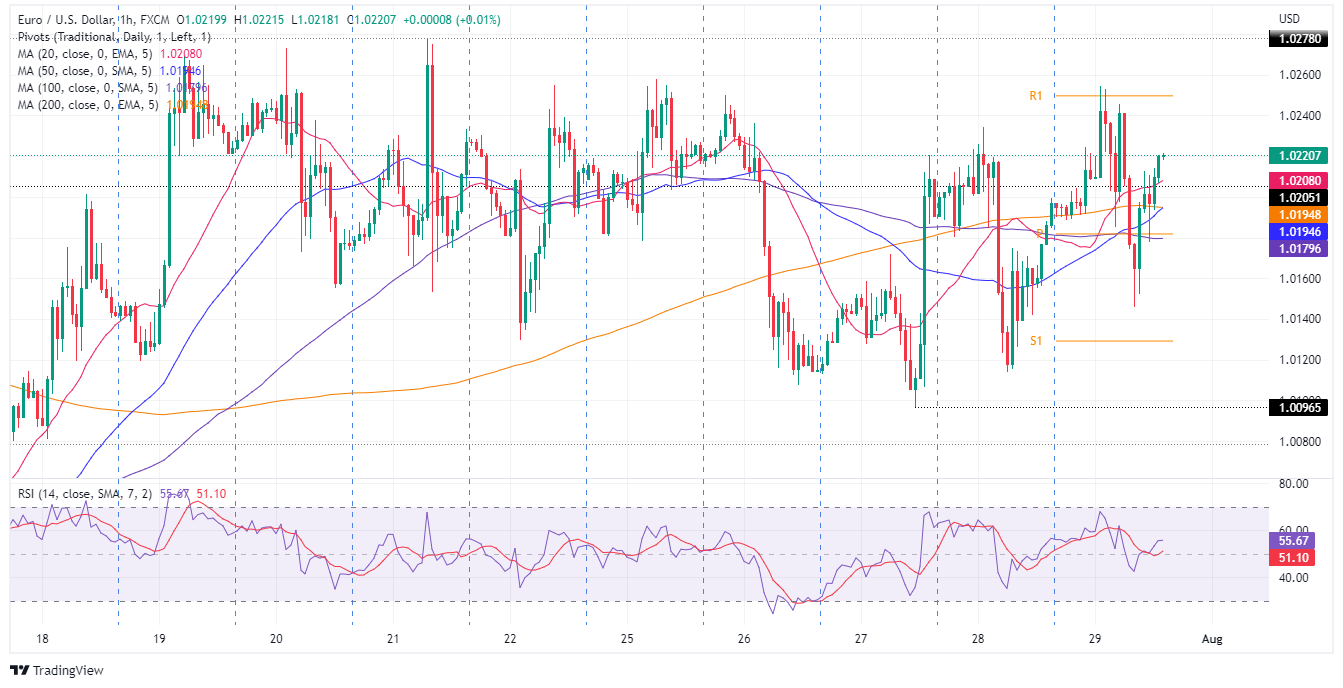
EUR/USD 1-hour chart
In the near term, the EUR/USD hourly chart depicts a sideways picture in the major. Since July 19, the EUR/USD has been trading in the 1.0096-1.0278 range, unable to break either side of the trading range, but EUR/USD traders should notice that the hourly EMAs sit below the spot price, signaling that buying pressure might be building.
Therefore, the EUR/USD first resistance would be the R1 daily pivot at 1.0250. Once cleared, the next resistance would be 1.0278, followed by 1.0300. On the flip side, the EUR/USD first support would be the 20-hour EMA at 1.0206. Break below will expose the confluence of the 200 and 50-hours EMAs at around 1.0192-94, followed by the 100-hour EMA at 1.0179.
EUR/USD Key Technical Levels


© 2000-2026. Bản quyền Teletrade.
Trang web này được quản lý bởi Teletrade D.J. LLC 2351 LLC 2022 (Euro House, Richmond Hill Road, Kingstown, VC0100, St. Vincent and the Grenadines).
Thông tin trên trang web không phải là cơ sở để đưa ra quyết định đầu tư và chỉ được cung cấp cho mục đích làm quen.
Giao dịch trên thị trường tài chính (đặc biệt là giao dịch sử dụng các công cụ biên) mở ra những cơ hội lớn và tạo điều kiện cho các nhà đầu tư sẵn sàng mạo hiểm để thu lợi nhuận, tuy nhiên nó mang trong mình nguy cơ rủi ro khá cao. Chính vì vậy trước khi tiến hành giao dịch cần phải xem xét mọi mặt vấn đề chấp nhận tiến hành giao dịch cụ thể xét theo quan điểm của nguồn lực tài chính sẵn có và mức độ am hiểu thị trường tài chính.
Sử dụng thông tin: sử dụng toàn bộ hay riêng biệt các dữ liệu trên trang web của công ty TeleTrade như một nguồn cung cấp thông tin nhất định. Việc sử dụng tư liệu từ trang web cần kèm theo liên kết đến trang teletrade.vn. Việc tự động thu thập số liệu cũng như thông tin từ trang web TeleTrade đều không được phép.
Xin vui lòng liên hệ với pr@teletrade.global nếu có câu hỏi.
ngân hàng