- Phân tích
- Tin tức và các công cụ
- Tin tức thị trường
- Gold Price Forecast: XAU/USD looks north towards $1,782 ahead of Jackson Hole – Confluence Detector
Gold Price Forecast: XAU/USD looks north towards $1,782 ahead of Jackson Hole – Confluence Detector
- Gold price extends its recovery rally into a fourth straight day on Thursday.
- Profit-taking on US dollar longs ahead of Jackson Hole supports the bullion.
- XAU/USD eyes $1,782 on a sustained break above the key $1,765 level.
Gold price is extending its three-day recovery rally on Thursday, capitalizing on the ongoing correction in the US dollar across the board. China announced additional economic stimulus to support growth late Wednesday, which has lifted the overall market mood and reduced the safe-haven demand for the greenback. Further, investors are resorting to position readjustment ahead of the critical US events, in the form of the Fed’s Jackson Hole Symposium and Friday’s Chair Jerome Powell’s speech. The US Treasury yields are retreating from multi-week highs, offering additional support to the non-yielding bullion. Markets are eagerly awaiting the remarks from Powell for fresh clues on the Fed’s tightening path and his outlook on the economy as well as on inflation.
Also read: Gold Price Forecast: Will the XAU/USD recovery extend ahead of Jackson Hole?
Gold Price: Key levels to watch
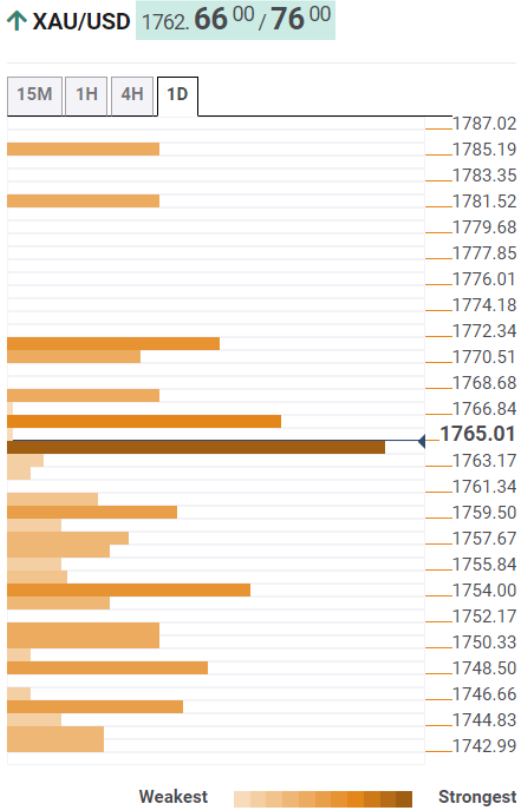
The Technical Confluence Detector shows that the gold price is challenging powerful resistance at $1,765, the convergence of the Fibonacci 61.8% one-month, pivot point one-day R2 and the previous high four-hour.
The next immediate hurdle is seen at $1,767, the SMA10 one-day, above which the confluence of the SMA50 one-day and the pivot point one-day R3 is aligned at $1,772.
A sustained move above the latter will kickstart a fresh upswing towards the Fibonacci 61.8% one-week at $1,782.
Alternatively, the metal could find some comfort at around $1,759, the Fibonacci 23.6% one-week. The Fibonacci 23.6% one-day at $1,754 could come to the rescue of buyers should the retreat extend.
A dense cluster of support levels around $1,750 will be next on sellers’ radars. That demand area is the intersection of the SMA200 four-hour, SMA5 one-day and Fibonacci 61.8% one-day.
Here is how it looks on the tool
About Technical Confluences Detector
The TCD (Technical Confluences Detector) is a tool to locate and point out those price levels where there is a congestion of indicators, moving averages, Fibonacci levels, Pivot Points, etc. If you are a short-term trader, you will find entry points for counter-trend strategies and hunt a few points at a time. If you are a medium-to-long-term trader, this tool will allow you to know in advance the price levels where a medium-to-long-term trend may stop and rest, where to unwind positions, or where to increase your position size.


© 2000-2026. Bản quyền Teletrade.
Trang web này được quản lý bởi Teletrade D.J. LLC 2351 LLC 2022 (Euro House, Richmond Hill Road, Kingstown, VC0100, St. Vincent and the Grenadines).
Thông tin trên trang web không phải là cơ sở để đưa ra quyết định đầu tư và chỉ được cung cấp cho mục đích làm quen.
Giao dịch trên thị trường tài chính (đặc biệt là giao dịch sử dụng các công cụ biên) mở ra những cơ hội lớn và tạo điều kiện cho các nhà đầu tư sẵn sàng mạo hiểm để thu lợi nhuận, tuy nhiên nó mang trong mình nguy cơ rủi ro khá cao. Chính vì vậy trước khi tiến hành giao dịch cần phải xem xét mọi mặt vấn đề chấp nhận tiến hành giao dịch cụ thể xét theo quan điểm của nguồn lực tài chính sẵn có và mức độ am hiểu thị trường tài chính.
Sử dụng thông tin: sử dụng toàn bộ hay riêng biệt các dữ liệu trên trang web của công ty TeleTrade như một nguồn cung cấp thông tin nhất định. Việc sử dụng tư liệu từ trang web cần kèm theo liên kết đến trang teletrade.vn. Việc tự động thu thập số liệu cũng như thông tin từ trang web TeleTrade đều không được phép.
Xin vui lòng liên hệ với pr@teletrade.global nếu có câu hỏi.
ngân hàng