- Phân tích
- Tin tức và các công cụ
- Tin tức thị trường
- Gold Price Forecast: XAU/USD looks to $1,700 amid Fed rate hike bets – Confluence Detector
Gold Price Forecast: XAU/USD looks to $1,700 amid Fed rate hike bets – Confluence Detector
- Gold continues losing ground for the second straight day and drops to over a one-month low.
- Strong follow-through USD buying, rising US bond yields continue to weigh on the commodity.
- The risk-off impulse might turn out to be the only factor that might help limit any further losses.
Gold remains under heavy selling pressure for the second successive day on Monday and drops to over a one-month low, around the $1,720 area during the early part of the European session. The US dollar hits a fresh two-decade high amid rising bets for more aggressive Fed rate hikes and continues to weigh on the dollar-denominated commodity.
In fact, the markets are pricing in a greater chance of a 75 bps rate increase at the September FOMC meeting. A further rise in the US Treasury bond yields reinforces market expectations, which is seen as another factor driving flows away from the non-yielding yellow metal. That said, the prevalent risk-off environment could offer some support to the safe-haven gold and help limit any further losses, at least for the time being.
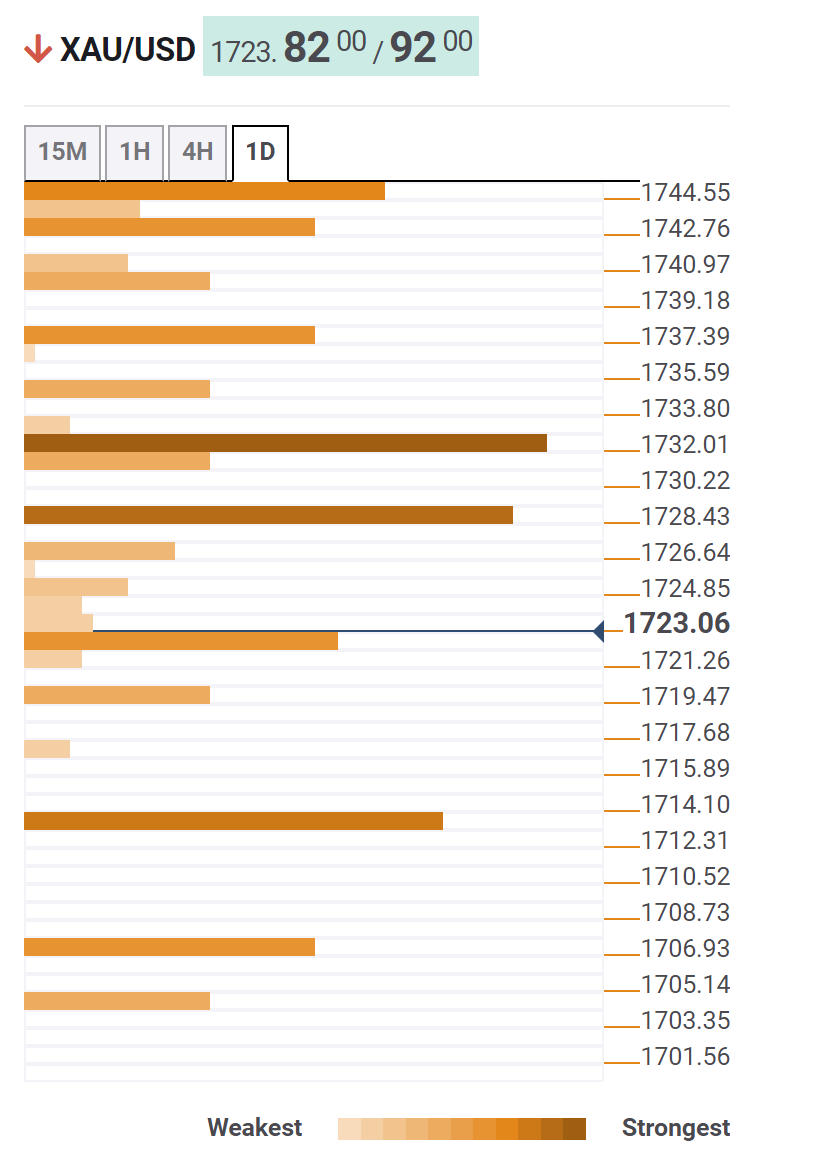
Gold Price: Key levels to watch
The Technical Confluence Detector shows that the next relevant support for gold is pegged near the $1,719 area - Pivot Point One Day S2. This is closely followed by $1,714-$1,713 zone - Fibonacci 23.6% One month. A convincing break below will expose the $1,706-$1,705 support - Pivot Point One Week S2 and the $1,700 round-figure mark. Some follow-through selling might make the XAU/USD vulnerable to retesting the YTD low, around the $1,680 region touched in July.
On the flip side, attempted recovery moves might now confront stiff resistance near the $1,728-$1,729 confluence support breakpoint, comprising Previous Week Low and Pivot Point One Day S1. The next relevant hurdle is pegged near the $1,732-$1,733 region - Fibonacci 38.2% One Month. Sustained strength beyond could trigger a short-covering rally towards the $1,737 zone - Fibonacci 23.6% One Week - en route to the $1,741-$1,742 region - Fibonacci 38.2% One Week - and the $1,745 barrier.
About Technical Confluences Detector
The TCD (Technical Confluences Detector) is a tool to locate and point out those price levels where there is a congestion of indicators, moving averages, Fibonacci levels, Pivot Points, etc. If you are a short-term trader, you will find entry points for counter-trend strategies and hunt a few points at a time. If you are a medium-to-long-term trader, this tool will allow you to know in advance the price levels where a medium-to-long-term trend may stop and rest, where to unwind positions, or where to increase your position size.


© 2000-2026. Bản quyền Teletrade.
Trang web này được quản lý bởi Teletrade D.J. LLC 2351 LLC 2022 (Euro House, Richmond Hill Road, Kingstown, VC0100, St. Vincent and the Grenadines).
Thông tin trên trang web không phải là cơ sở để đưa ra quyết định đầu tư và chỉ được cung cấp cho mục đích làm quen.
Giao dịch trên thị trường tài chính (đặc biệt là giao dịch sử dụng các công cụ biên) mở ra những cơ hội lớn và tạo điều kiện cho các nhà đầu tư sẵn sàng mạo hiểm để thu lợi nhuận, tuy nhiên nó mang trong mình nguy cơ rủi ro khá cao. Chính vì vậy trước khi tiến hành giao dịch cần phải xem xét mọi mặt vấn đề chấp nhận tiến hành giao dịch cụ thể xét theo quan điểm của nguồn lực tài chính sẵn có và mức độ am hiểu thị trường tài chính.
Sử dụng thông tin: sử dụng toàn bộ hay riêng biệt các dữ liệu trên trang web của công ty TeleTrade như một nguồn cung cấp thông tin nhất định. Việc sử dụng tư liệu từ trang web cần kèm theo liên kết đến trang teletrade.vn. Việc tự động thu thập số liệu cũng như thông tin từ trang web TeleTrade đều không được phép.
Xin vui lòng liên hệ với pr@teletrade.global nếu có câu hỏi.
ngân hàng