- Phân tích
- Tin tức và các công cụ
- Tin tức thị trường
- Gold Price Forecast: XAU/USD bears target $1,688 ahead of key US data – Confluence Detector
Gold Price Forecast: XAU/USD bears target $1,688 ahead of key US data – Confluence Detector
- Gold price licks its wounds near monthly lows after testing the $1,700 mark.
- US dollar rallies with yields as investors cheer hawkish Fed and ECB rate hike bets.
- XAU/USD could extend losses towards $1,688 on a firm break below $1,700.
Gold price is on a five-day downtrend, eyeing a sustained move below the $1,700 mark amid unrelenting buying interest seen around the US dollar. Markets seem to be convinced about a 75 bps Fed rate hike in September, reflective of the ongoing rally in the US Treasury yields across the curve. The two-year US rates are at their highest level since 2007 while the benchmark 10-year yields are at two-month highs above 3.20%. According to CME FedWatch Tool, there is a 72% probability of an outsized rate hike this month. Further, Eurozone inflation hit another record high at 9.1% in August, cementing a 75 bps Sept ECB rate hike. Expectations of aggressive tightening from the Fed and the ECB offset weak US ADP jobs data, weighing negatively on the non-yielding bullion. The bright metal now looks forward to the US ISM Manufacturing PMI and Nonfarm Payrolls data for fresh trading directives.
Also read: Gold Price Forecast: XAUUSD close to confirming a long-term double top
Gold Price: Key levels to watch
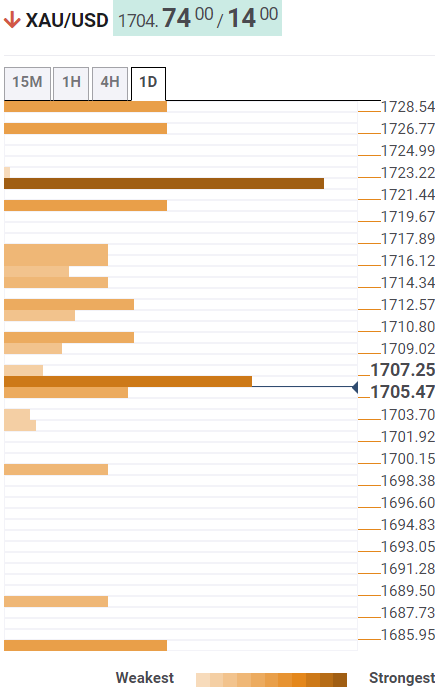
The Technical Confluence Detector shows that the gold price is gathering strength for the next push lower, as bears aim for the pivot point one-day S2 at $1,700.
If sellers find a strong foothold below the latter, a sharp sell-off towards the pivot point one-day S3 at $1,688 will be inevitable.
On the flip side, any recovery attempts will need acceptance above the convergence of the pivot point one-week S2 and the previous low four-hour at $1,707.
The previous day’s low of $1,710 will challenge the road to recovery, above which the Bollinger Band one-day Lower at $1,713 will come into play.
Further up, a dense cluster of resistance levels around $1,716 will be a tough nut to crack for bulls. That price zone is the confluence of the Fibonacci 38.2% one-day and SMA5 four-hour.
Here is how it looks on the tool
About Technical Confluences Detector
The TCD (Technical Confluences Detector) is a tool to locate and point out those price levels where there is a congestion of indicators, moving averages, Fibonacci levels, Pivot Points, etc. If you are a short-term trader, you will find entry points for counter-trend strategies and hunt a few points at a time. If you are a medium-to-long-term trader, this tool will allow you to know in advance the price levels where a medium-to-long-term trend may stop and rest, where to unwind positions, or where to increase your position size.


© 2000-2026. Bản quyền Teletrade.
Trang web này được quản lý bởi Teletrade D.J. LLC 2351 LLC 2022 (Euro House, Richmond Hill Road, Kingstown, VC0100, St. Vincent and the Grenadines).
Thông tin trên trang web không phải là cơ sở để đưa ra quyết định đầu tư và chỉ được cung cấp cho mục đích làm quen.
Giao dịch trên thị trường tài chính (đặc biệt là giao dịch sử dụng các công cụ biên) mở ra những cơ hội lớn và tạo điều kiện cho các nhà đầu tư sẵn sàng mạo hiểm để thu lợi nhuận, tuy nhiên nó mang trong mình nguy cơ rủi ro khá cao. Chính vì vậy trước khi tiến hành giao dịch cần phải xem xét mọi mặt vấn đề chấp nhận tiến hành giao dịch cụ thể xét theo quan điểm của nguồn lực tài chính sẵn có và mức độ am hiểu thị trường tài chính.
Sử dụng thông tin: sử dụng toàn bộ hay riêng biệt các dữ liệu trên trang web của công ty TeleTrade như một nguồn cung cấp thông tin nhất định. Việc sử dụng tư liệu từ trang web cần kèm theo liên kết đến trang teletrade.vn. Việc tự động thu thập số liệu cũng như thông tin từ trang web TeleTrade đều không được phép.
Xin vui lòng liên hệ với pr@teletrade.global nếu có câu hỏi.
ngân hàng