- Phân tích
- Tin tức và các công cụ
- Tin tức thị trường
- US dollar is meeting offers following a mixed US NFP report
US dollar is meeting offers following a mixed US NFP report
- US dollar is under pressure and scrutiny following the mixed US NFP report.
- The bears are looking to the weekly chart for clues as to where the dollar could be correcting towards.
The US dollar, as measured vs. a basket of major currencies in the DXY index, fluttered on the release of the US Labor Department's closely watched Nonfarm Payrolls employment report. While the data showed an increase of 315,000 jobs last month after surging 526,000 in July, the disappointments came in the form of Average Hourly Earnings which rose 0.3% compared with expectations of 0.4% and the Unemployment Rate which missed expectations of 3.5% vs. 3.7% actual. However, the stronger than expected Participation Rate could go some way toward explaining this miss given the increase in the number of people joining the labour force last month.
- Labour Force Participation Rate July: 62.4% vs. estimated 62.2%; previous 62.1%.
Despite mixed data, traders see a 75% chance of a third straight 75 basis points rate hike in September and expect rates to peak at 3.90% in March 2023. The US dollar has since recovered from the knee-jerk sell-off and lows of the day down at 109.049 and is trying to hang on to the correction in the 109.20s at the time of writing. It had recovered to 109.46, so it remains slightly pressured still. US yields are under pressure as well, with the 2-year US Treasury yield down over 2.57% at the lows of 3.406%
Despite today's disappointments, the US dollar index had rallied to a fresh 20-year high on Thursday of 109.99, bolstered by robust US data which leaves the DXY on track for a 0.5% weekly gain still on a closing basis. However, given that the data has a little something for everyone, it eases some pressure on the Federal Reserve looking to cool down labour demand and the overall economy to bring inflation back to its 2% target which is a factor that can weigh on the greenback for the forthcoming days as markets continue to digest the implications. Traders will now look to the August Consumer Price Index report due in the middle of this month for clues on the next rate increase ahead of when the Fed meets.
DXY H1 chart
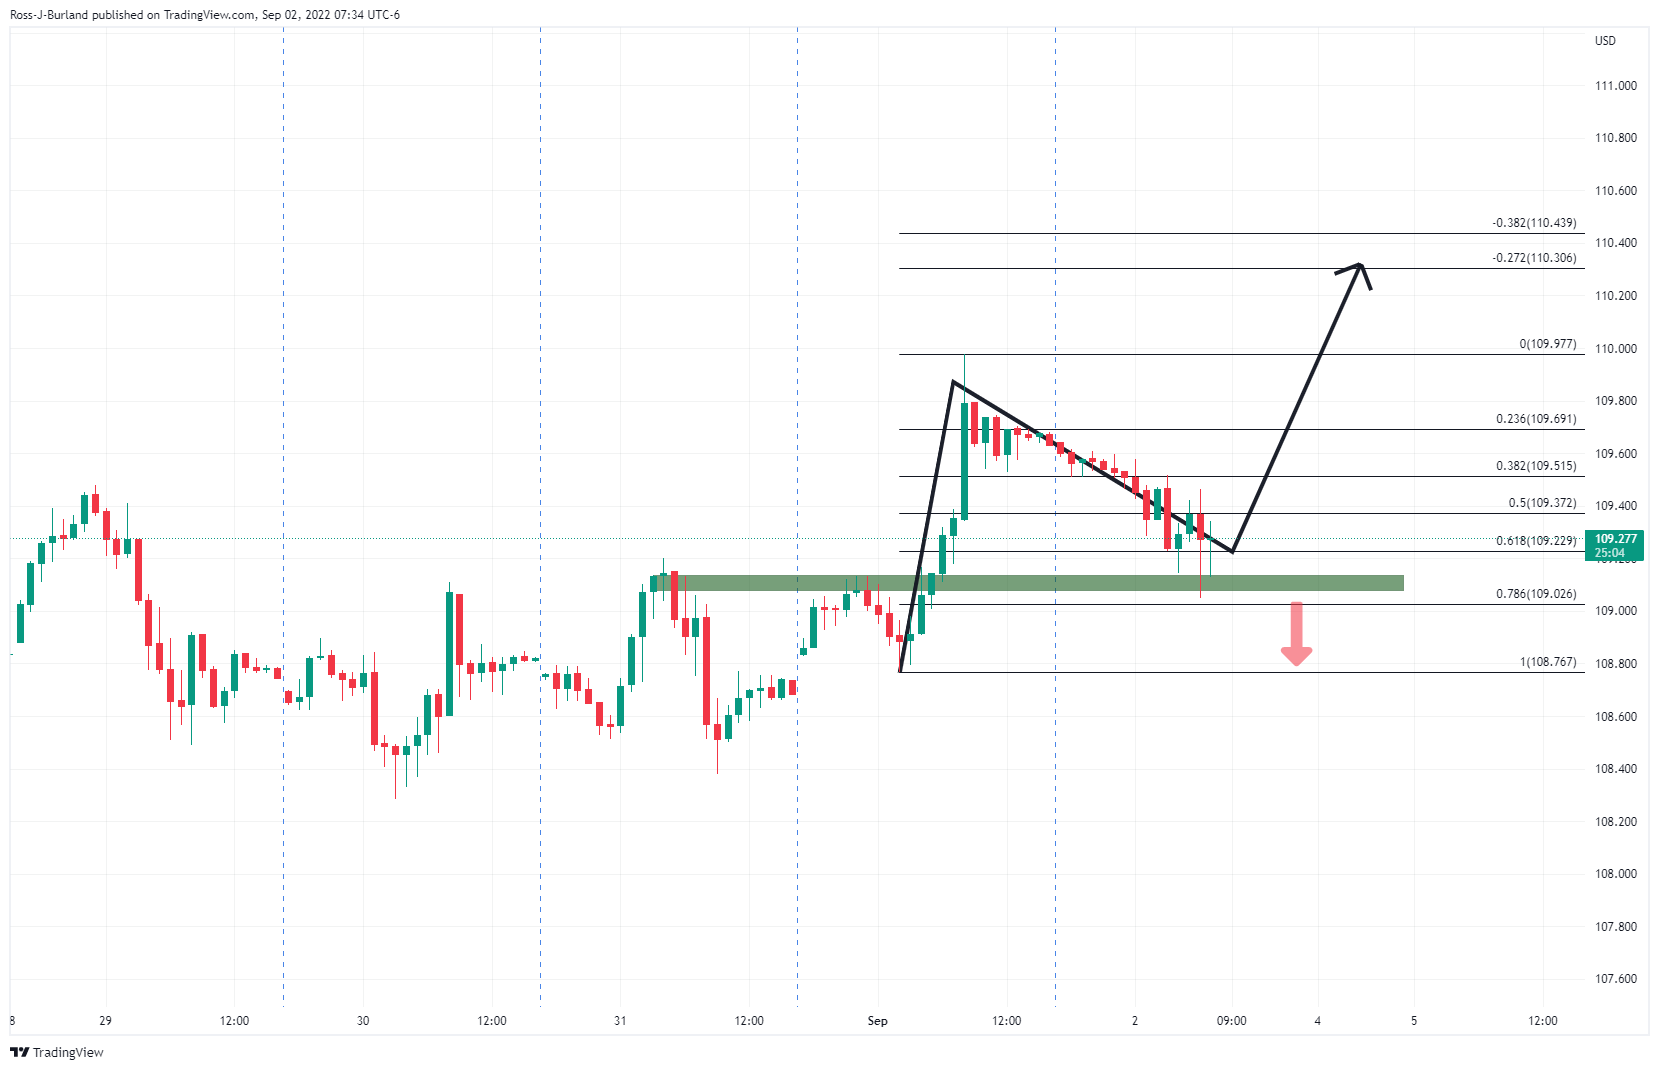
From a technical standpoint, the index is trying to establish around a 61.8% Fibonacci retracement level of the prior hourly bullish impulse. If the bulls commit, then there will be prospects of a bullish extension for the day ahead and open next week with sights beyond the 110.00 level. On the other hand, should the support area give way, a deeper correction of the weekly bullish run could be on the cards for next week:
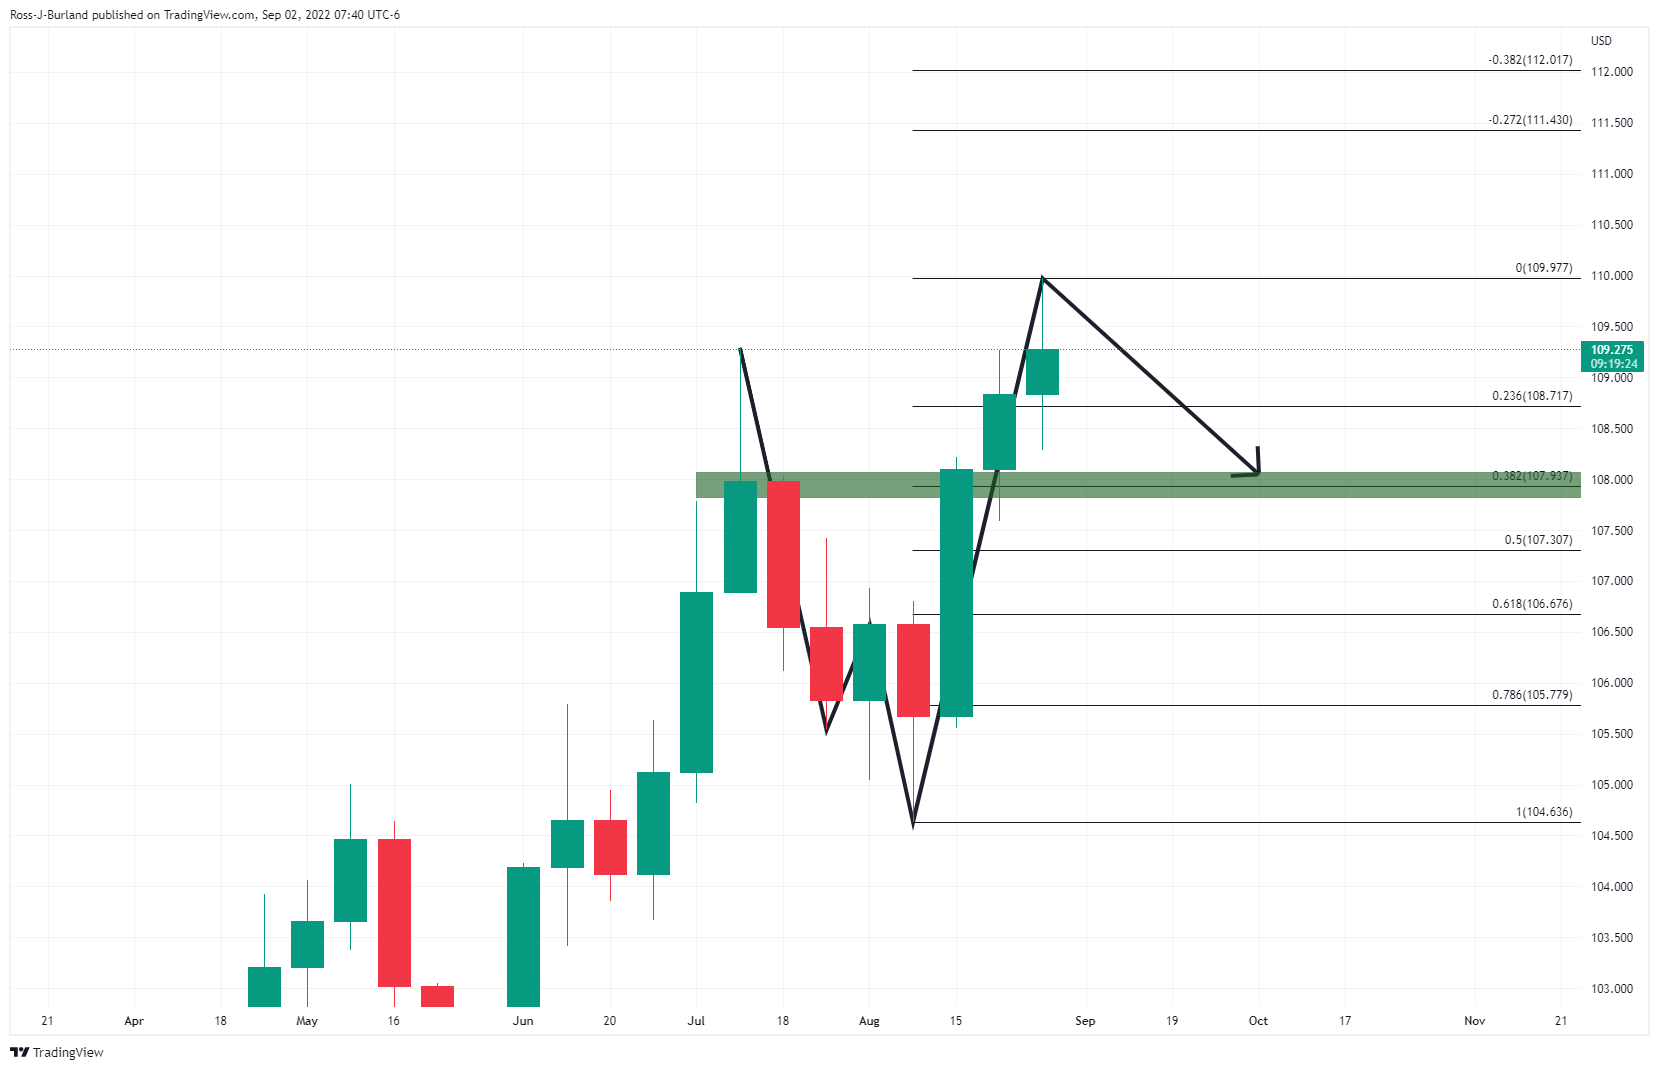
The W-formation on the weekly chart is a reversion pattern and there are prospects of a correction into the prior highs that meet with the 38.2% Fibo retracement.


© 2000-2026. Bản quyền Teletrade.
Trang web này được quản lý bởi Teletrade D.J. LLC 2351 LLC 2022 (Euro House, Richmond Hill Road, Kingstown, VC0100, St. Vincent and the Grenadines).
Thông tin trên trang web không phải là cơ sở để đưa ra quyết định đầu tư và chỉ được cung cấp cho mục đích làm quen.
Giao dịch trên thị trường tài chính (đặc biệt là giao dịch sử dụng các công cụ biên) mở ra những cơ hội lớn và tạo điều kiện cho các nhà đầu tư sẵn sàng mạo hiểm để thu lợi nhuận, tuy nhiên nó mang trong mình nguy cơ rủi ro khá cao. Chính vì vậy trước khi tiến hành giao dịch cần phải xem xét mọi mặt vấn đề chấp nhận tiến hành giao dịch cụ thể xét theo quan điểm của nguồn lực tài chính sẵn có và mức độ am hiểu thị trường tài chính.
Sử dụng thông tin: sử dụng toàn bộ hay riêng biệt các dữ liệu trên trang web của công ty TeleTrade như một nguồn cung cấp thông tin nhất định. Việc sử dụng tư liệu từ trang web cần kèm theo liên kết đến trang teletrade.vn. Việc tự động thu thập số liệu cũng như thông tin từ trang web TeleTrade đều không được phép.
Xin vui lòng liên hệ với pr@teletrade.global nếu có câu hỏi.
ngân hàng