- Phân tích
- Tin tức và các công cụ
- Tin tức thị trường
- Silver Price Forecast: XAG/USD advances steadily, eyeing the $20.00 figure
Silver Price Forecast: XAG/USD advances steadily, eyeing the $20.00 figure
- XAG/USD climbed on a risk-on impulse and lowered US T-bond yields.
- US PPI for August tempered inflationary pressures on the producer side.
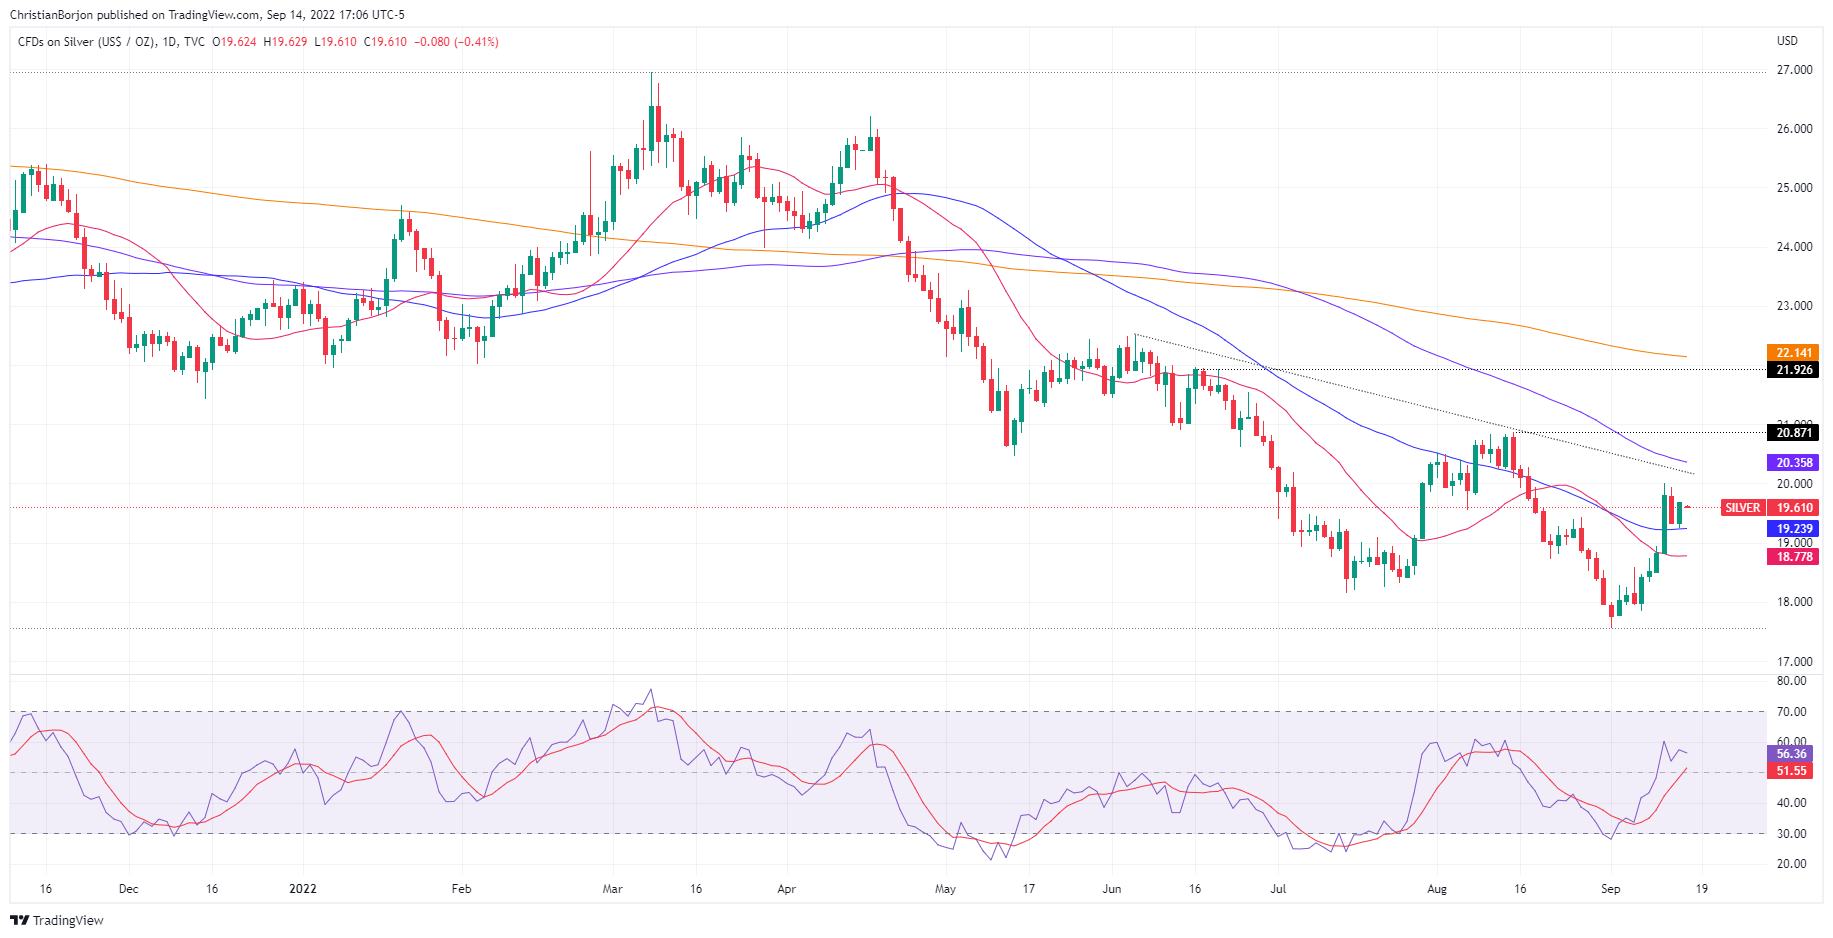
- XAG/USD Price Analysis: Break above $20.00 to send silver towards $21.00 mark.
Silver price rebounds at around the 50-day EMA and climbs towards a daily high near $19.69 on Wednesday after the US Labor Department revealed that August PPI was aligned with expectations easing inflationary pressures on the producer side, contrarily to Tuesday’s CPI.
Therefore, the XAG/USD is trading at $19.61, above its opening price by 1.86%.
Before Wall Street opened, US data revealed by the Bureau of Labour Statistics (BLS) showed that the PPI for August shrank by 0.1%, aligned with the consensus, while the year-over-year figure was down at 8.7%, less than July’s 9.8% report. Meanwhile, the so-called core PPI, which excludes volatile items, edged higher, 0.4% MoM, but on an annual reading, edged up by 7.3%.
In the meantime, the US Dollar Index, a measure of the buck’s value against a basket of six currencies, finished Wednesday’s session down by 0.15%, at 109.648, undermined by US Treasury yields, mainly the 10-year benchmark note rate, unmoved during the day at around 3.404%.
The reflection of the abovementioned is the US Dollar Index, losing some traction, down by 0.09%, below the 110.000 mark. At the same time, the US 10-year benchmark note rate shows signs of exhaustion, flat at around 3.414%.
Another tailwind for the white metal prices was that the US 10-year TIPS, a proxy for real yields, gained only one bps, sitting at 0.939%.
On Thursday, the US economic docket will feature unemployment claims, retail sales, and the New York and Philadelphia Fed Manufacturing Indices, a prelude for October’s ISM report.
Silver Price Analysis (XAG/USD): Technical outlook
The XAG/USD daily chart illustrates the white metal as neutral-to-downward biased. However, if silver buyers reclaim the $20.00 mark, that could pave the way for a test of a four-month-old downslope trendline around $20.20 before reaching the 100-day EMA at $20.39. A breach of the latter will expose the August 15 cycle high at $20.87, ahead of the $21.00 psychological level.


© 2000-2026. Bản quyền Teletrade.
Trang web này được quản lý bởi Teletrade D.J. LLC 2351 LLC 2022 (Euro House, Richmond Hill Road, Kingstown, VC0100, St. Vincent and the Grenadines).
Thông tin trên trang web không phải là cơ sở để đưa ra quyết định đầu tư và chỉ được cung cấp cho mục đích làm quen.
Giao dịch trên thị trường tài chính (đặc biệt là giao dịch sử dụng các công cụ biên) mở ra những cơ hội lớn và tạo điều kiện cho các nhà đầu tư sẵn sàng mạo hiểm để thu lợi nhuận, tuy nhiên nó mang trong mình nguy cơ rủi ro khá cao. Chính vì vậy trước khi tiến hành giao dịch cần phải xem xét mọi mặt vấn đề chấp nhận tiến hành giao dịch cụ thể xét theo quan điểm của nguồn lực tài chính sẵn có và mức độ am hiểu thị trường tài chính.
Sử dụng thông tin: sử dụng toàn bộ hay riêng biệt các dữ liệu trên trang web của công ty TeleTrade như một nguồn cung cấp thông tin nhất định. Việc sử dụng tư liệu từ trang web cần kèm theo liên kết đến trang teletrade.vn. Việc tự động thu thập số liệu cũng như thông tin từ trang web TeleTrade đều không được phép.
Xin vui lòng liên hệ với pr@teletrade.global nếu có câu hỏi.
ngân hàng