- Phân tích
- Tin tức và các công cụ
- Tin tức thị trường
- USD/JPY Price Analysis: Breaks above the 143.60 resistance, as buyers eye 145.00
USD/JPY Price Analysis: Breaks above the 143.60 resistance, as buyers eye 145.00
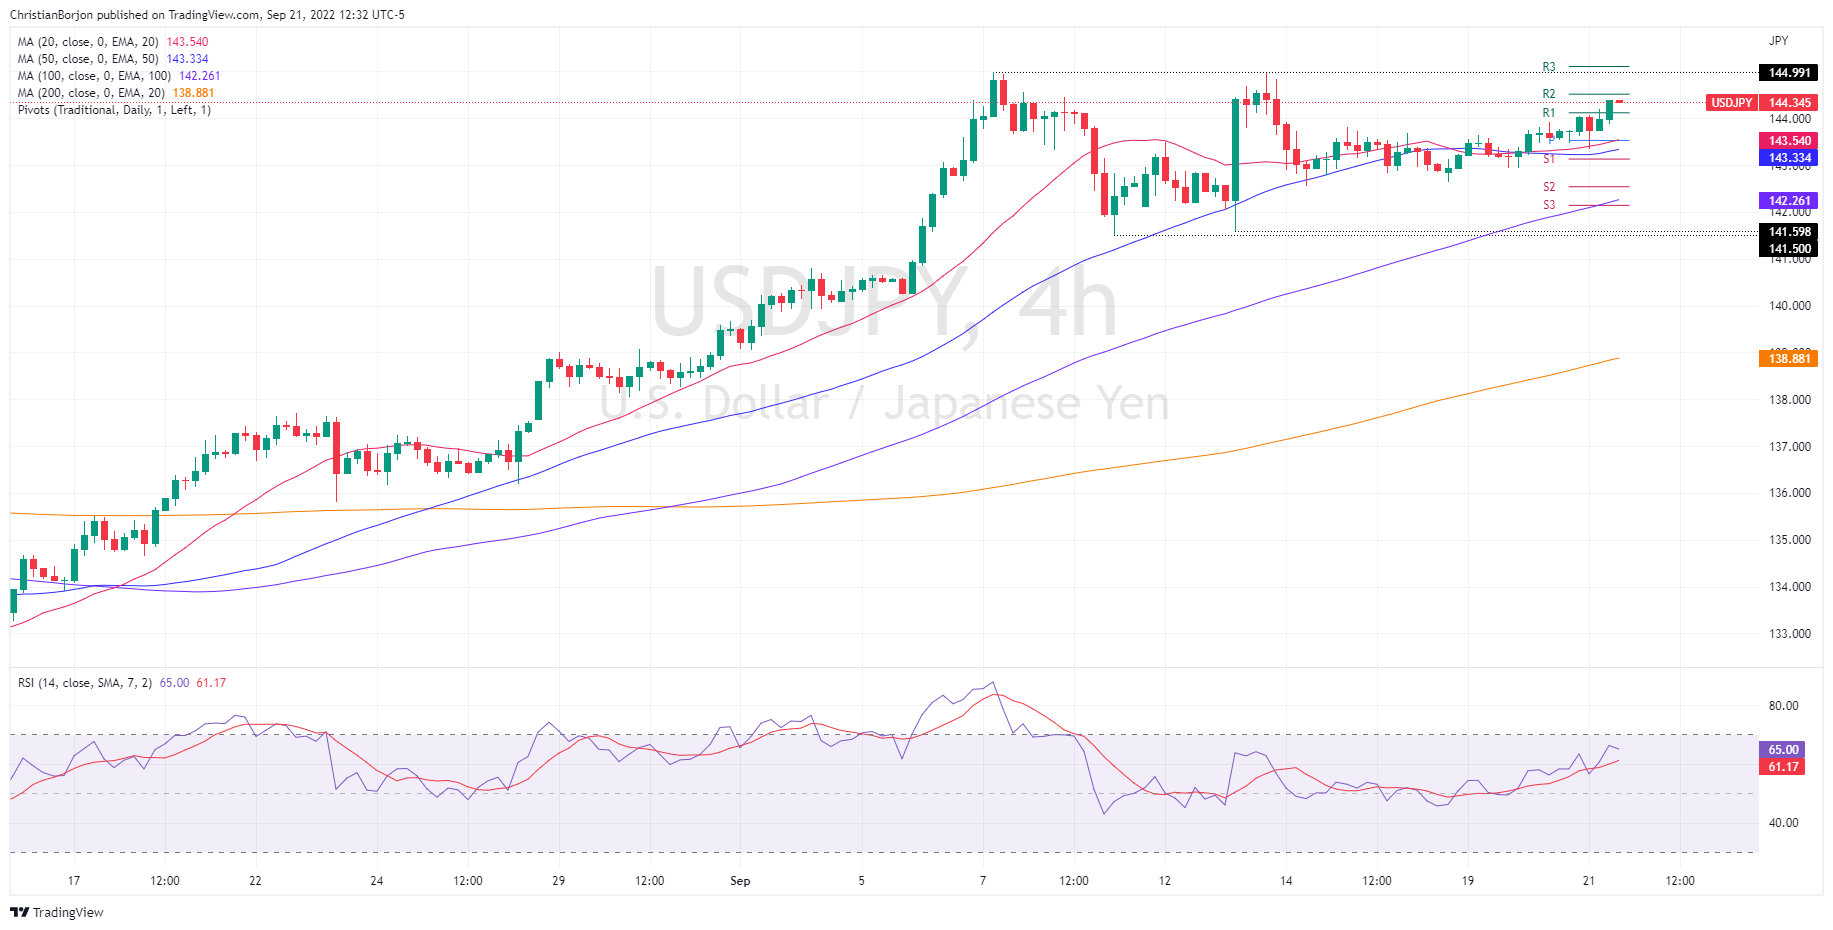
- The USD/JPY broke out of the 142.60-143.60 area on Wednesday, gaining some 0.43%.
- From a long-term perspective, the USD/JPY is still upward biased, further confirmed by the RSI’s remaining in bullish territory.
- Short term, the USD/JPY is also upward biased and could aim towards the 145.00 area if the Fed hikes 75 bps and keeps its hawkish stance.
The USD/JPY slightly advances for the third consecutive day, hitting a fresh weekly high at around 144.31, ahead of the US Federal Reserve monetary policy decision, where the US central bank is awaited to lift rates above the 3% threshold. Therefore, the USD/JPY is trading at 144.31, above the opening price by 0.41%, at the time of writing.
USD/JPY Price Analysis: Technical outlook
From a daily chart perspective, the USD/JPY remains upward biased, underpinned by the US 10-year Treasury bond yield movement. Worth noting that the Relative Strength Index (RSI) got a respite after reaching the YTD high at 144.99. though at the time of typing, RSI’s just crossed above its 7-day SMA, depicting that buyers are gathering momentum ahead of the US Fed decision.
Short term, the USD/JPY four-hour chart portrays the same scenario as the daily chart, upward biased. Once the USD/JPY hit the YTD high, it dived towards 141.50, September’s low, forming a base. Since then, the major began trading around the 141.50-144.90 area, but lately, stuck in the 142.60-143.60 range. However, during Wednesday’s session, the USD/JPY broke upward, opening the door for a test of the August 1998 high of 147.67.
Therefore, the USD/JPY’s first resistance would be the YTD high at 144.99. A break above will expose the R3 daily pivot at 145.09, followed by the 146.00 psychological level, ahead of August’s 1998 high at 147.67. On the flip side, the USD/JPY first support would be the R1 daily pivot at 144.12. A breach of the latter will expose the confluence of the daily pivot and the 20-EMA at 143.54, followed by the 50-EMA at 143.33, ahead of the S1 pivot at around 143.00.
USD/JPY Key Technical Levels


© 2000-2026. Bản quyền Teletrade.
Trang web này được quản lý bởi Teletrade D.J. LLC 2351 LLC 2022 (Euro House, Richmond Hill Road, Kingstown, VC0100, St. Vincent and the Grenadines).
Thông tin trên trang web không phải là cơ sở để đưa ra quyết định đầu tư và chỉ được cung cấp cho mục đích làm quen.
Giao dịch trên thị trường tài chính (đặc biệt là giao dịch sử dụng các công cụ biên) mở ra những cơ hội lớn và tạo điều kiện cho các nhà đầu tư sẵn sàng mạo hiểm để thu lợi nhuận, tuy nhiên nó mang trong mình nguy cơ rủi ro khá cao. Chính vì vậy trước khi tiến hành giao dịch cần phải xem xét mọi mặt vấn đề chấp nhận tiến hành giao dịch cụ thể xét theo quan điểm của nguồn lực tài chính sẵn có và mức độ am hiểu thị trường tài chính.
Sử dụng thông tin: sử dụng toàn bộ hay riêng biệt các dữ liệu trên trang web của công ty TeleTrade như một nguồn cung cấp thông tin nhất định. Việc sử dụng tư liệu từ trang web cần kèm theo liên kết đến trang teletrade.vn. Việc tự động thu thập số liệu cũng như thông tin từ trang web TeleTrade đều không được phép.
Xin vui lòng liên hệ với pr@teletrade.global nếu có câu hỏi.
ngân hàng