- Phân tích
- Tin tức và các công cụ
- Tin tức thị trường
- Gold Price Forecast: XAU/USD has a smooth run towards $1,680 – Confluence Detector
Gold Price Forecast: XAU/USD has a smooth run towards $1,680 – Confluence Detector
- Gold price grinds higher during four-day uptrend, eyes first weekly gain in three.
- DXY pullback, quarter-end positioning favor XAU/USD buyers despite fears of recession.
- Failure to cross the $1,680 hurdle, backed by upbeat US Core PCE Inflation, could recall gold sellers.
Gold price (XAU/USD) remains on the front foot for the fourth consecutive day while cheering the pullback in the US dollar. That said, the quarter positioning and hopes of stimulus from China, Japan and the UK, are some extra catalysts that could have underpinned the yellow metal corrective bounce off the yearly low, teasing $1,667 by the press time.
However, the firmer yields and fears of global economic slowdown, not to forget the geopolitical woes surrounding Russia and China, keeps XAU/USD buyers on dicey grounds. Furthermore, upbeat US data and hawkish central banks are likely to keep the metal prices down. As a result, today’s US Core Personal Consumption Expenditure (PCE) Price Index for August, expected 4.7% YoY versus 4.6% prior, mostly known as the Fed’s preferred inflation gauge, will be important for clear directions.
Also read: Gold Price Forecast: XAU/USD needs to make it through $1,674-75 hurdle to confirm a bottom
Gold Price: Key levels to watch
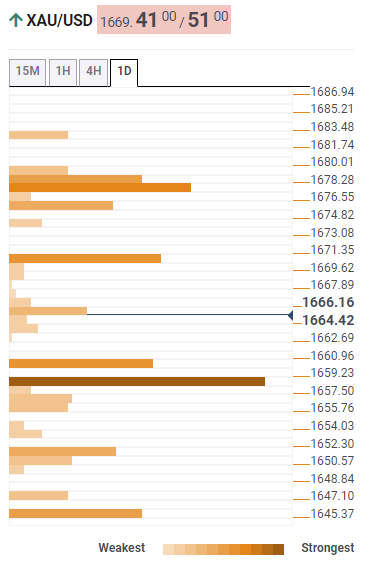
The Technical Confluence Detector shows that the gold price approaches short-term key hurdles to the north while staying beyond the $1,660-58 strong support zone, comprising Fibonacci 38.2% on one week and SMA10 on one day.
That said, the $1,671 level comprising the Pivot Point one day R1 and Fibonacci 61.8% on weekly, appears immediate challenge for the XAU/USD buyers.
Following that, multiple levels between $1,678-80 could test the metal buyers. The resistance zone includes the previous yearly bottom, SMA100 on 4H, Pivot Point one week R1 and Pivot Point one month S1.
In a case where the gold price rally beyond $1,680, the bulls can aim for the $1,700 threshold.
On the flip side, a sustained trading below $1,658 becomes necessary to recall the gold sellers.
Failing to do so can quickly fetch the quote to $1,650 support, SMA50 one hour and 23.6% on one week.
If at all the XAU/USD prices remain weak past $1,650, the $1,645 level encompassing Pivot Point one-month S2 could act as the last defense of the buyers.
Here is how it looks on the tool
About Technical Confluences Detector
The TCD (Technical Confluences Detector) is a tool to locate and point out those price levels where there is a congestion of indicators, moving averages, Fibonacci levels, Pivot Points, etc. If you are a short-term trader, you will find entry points for counter-trend strategies and hunt a few points at a time. If you are a medium-to-long-term trader, this tool will allow you to know in advance the price levels where a medium-to-long-term trend may stop and rest, where to unwind positions, or where to increase your position size.


© 2000-2026. Bản quyền Teletrade.
Trang web này được quản lý bởi Teletrade D.J. LLC 2351 LLC 2022 (Euro House, Richmond Hill Road, Kingstown, VC0100, St. Vincent and the Grenadines).
Thông tin trên trang web không phải là cơ sở để đưa ra quyết định đầu tư và chỉ được cung cấp cho mục đích làm quen.
Giao dịch trên thị trường tài chính (đặc biệt là giao dịch sử dụng các công cụ biên) mở ra những cơ hội lớn và tạo điều kiện cho các nhà đầu tư sẵn sàng mạo hiểm để thu lợi nhuận, tuy nhiên nó mang trong mình nguy cơ rủi ro khá cao. Chính vì vậy trước khi tiến hành giao dịch cần phải xem xét mọi mặt vấn đề chấp nhận tiến hành giao dịch cụ thể xét theo quan điểm của nguồn lực tài chính sẵn có và mức độ am hiểu thị trường tài chính.
Sử dụng thông tin: sử dụng toàn bộ hay riêng biệt các dữ liệu trên trang web của công ty TeleTrade như một nguồn cung cấp thông tin nhất định. Việc sử dụng tư liệu từ trang web cần kèm theo liên kết đến trang teletrade.vn. Việc tự động thu thập số liệu cũng như thông tin từ trang web TeleTrade đều không được phép.
Xin vui lòng liên hệ với pr@teletrade.global nếu có câu hỏi.
ngân hàng