- Phân tích
- Tin tức và các công cụ
- Tin tức thị trường
- Gold Price Forecast: Weekly closing above $1,700 is critical for XAU/USD bulls – Confluence Detector
Gold Price Forecast: Weekly closing above $1,700 is critical for XAU/USD bulls – Confluence Detector
- Gold price is on the defensive for the third consecutive day, away from three-week highs.
- US payrolls could offer clarity on the size of the November Fed rate hike.
- XAU/USD bulls could face an uphill task, with eyes on key US event risks.
Gold price is moving back and forth in a narrow range above $1,700, struggling for a clear directional bias. Investors have moved into caution trading while the US dollar clings to recent gains alongside the Treasury yields in the run-up to the NFP showdown. Market consensus for headline payrolls is +250K in September vs. August’s +315K. However, next week’s US inflation will be pivotal to seal in the size of the next Fed rate hike. A lack of clarity on the Fed tightening outlook combined with geopolitical tensions could keep the bright metal supported at lower levels. The upcoming US economic releases, therefore, hold the key to determining the next direction in the USD-sensitive precious metal. The demand-supply scenario for gold in India and China will be also closely followed.
Also read: Gold Price Forecast: Will XAU/USD chart a bull penant on weak US NFP?
Gold Price: Key levels to watch
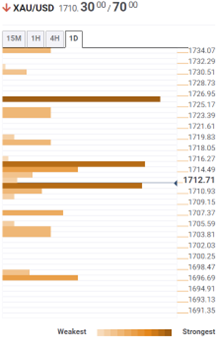
The Technical Confluence Detector shows that the gold price is eyeing a revisit of the previous day’s low at $1,707, below which the convergence of the SMA5 one-day and pivot point one-day S1 at $1,704 will come into play.
A fresh downswing will kick off on a firm break below the latter, threatening the $1,700 mark. The last line of defense for XAU buyers is seen at $1,697, the intersection of the SMA200 four-hour and the pivot point one-day S2.
On the flip side, the Fibonacci 23.6% one-day at $1,712 will offer immediate resistance. The next stop for optimists is envisioned around $1,716, where the Fibonacci 38.2% one-day and SMA10 four-hour meet.
Bulls will then aim for the Fibonacci 61.8% one-day at $1,719, followied by the SMA 50 one-day at $1,722.
The confluence of the pivot point one-month R1 and the previous day’s high at $1,726 could challenge bearish commitments.
Here is how it looks on the tool
About Technical Confluences Detector
The TCD (Technical Confluences Detector) is a tool to locate and point out those price levels where there is a congestion of indicators, moving averages, Fibonacci levels, Pivot Points, etc. If you are a short-term trader, you will find entry points for counter-trend strategies and hunt a few points at a time. If you are a medium-to-long-term trader, this tool will allow you to know in advance the price levels where a medium-to-long-term trend may stop and rest, where to unwind positions, or where to increase your position size.


© 2000-2026. Bản quyền Teletrade.
Trang web này được quản lý bởi Teletrade D.J. LLC 2351 LLC 2022 (Euro House, Richmond Hill Road, Kingstown, VC0100, St. Vincent and the Grenadines).
Thông tin trên trang web không phải là cơ sở để đưa ra quyết định đầu tư và chỉ được cung cấp cho mục đích làm quen.
Giao dịch trên thị trường tài chính (đặc biệt là giao dịch sử dụng các công cụ biên) mở ra những cơ hội lớn và tạo điều kiện cho các nhà đầu tư sẵn sàng mạo hiểm để thu lợi nhuận, tuy nhiên nó mang trong mình nguy cơ rủi ro khá cao. Chính vì vậy trước khi tiến hành giao dịch cần phải xem xét mọi mặt vấn đề chấp nhận tiến hành giao dịch cụ thể xét theo quan điểm của nguồn lực tài chính sẵn có và mức độ am hiểu thị trường tài chính.
Sử dụng thông tin: sử dụng toàn bộ hay riêng biệt các dữ liệu trên trang web của công ty TeleTrade như một nguồn cung cấp thông tin nhất định. Việc sử dụng tư liệu từ trang web cần kèm theo liên kết đến trang teletrade.vn. Việc tự động thu thập số liệu cũng như thông tin từ trang web TeleTrade đều không được phép.
Xin vui lòng liên hệ với pr@teletrade.global nếu có câu hỏi.
ngân hàng