- Phân tích
- Tin tức và các công cụ
- Tin tức thị trường
- AUD/USD Price Analysis: Bears push to the edge of the abyss, looking over it to
AUD/USD Price Analysis: Bears push to the edge of the abyss, looking over it to
- AUD/USD bulls eye the channel top near 0.6450 on a break of the 38.2% Fibonacci and 50% mean reversion area near 0.6380/0.6400.
- AUD/USD bears are moving the price towards the edge of the abyss and 0.6350.
AUD/USD has opened at support but hangs over the edge of the abyss at 0.6350 which guards the risk of a fall to 0.6150 for the week (s) ahead. The US dollar is on the march, supported by strong yields and the Federal Reserve's campaign to hike rates following Friday's strong US Nonfarm Payrolls data.
Speculators' net long positioning on the US dollar fell in the latest week to the lowest since mid-March, according to calculations by Reuters and U.S. Commodity Futures Trading Commission data released on Friday. This leaves scope for a reaccumulation of those positions that could add pressure to AUS/USD. The value of the net long dollar position slid to $9.44 billion in the week ended Oct. 4, from $10.43 billion the previous week, CFTC data showed.
The following illustrates both the bullish and bearish scenarios for days ahead with a strong bias to the downside longer term:
AUD/USD weekly charts
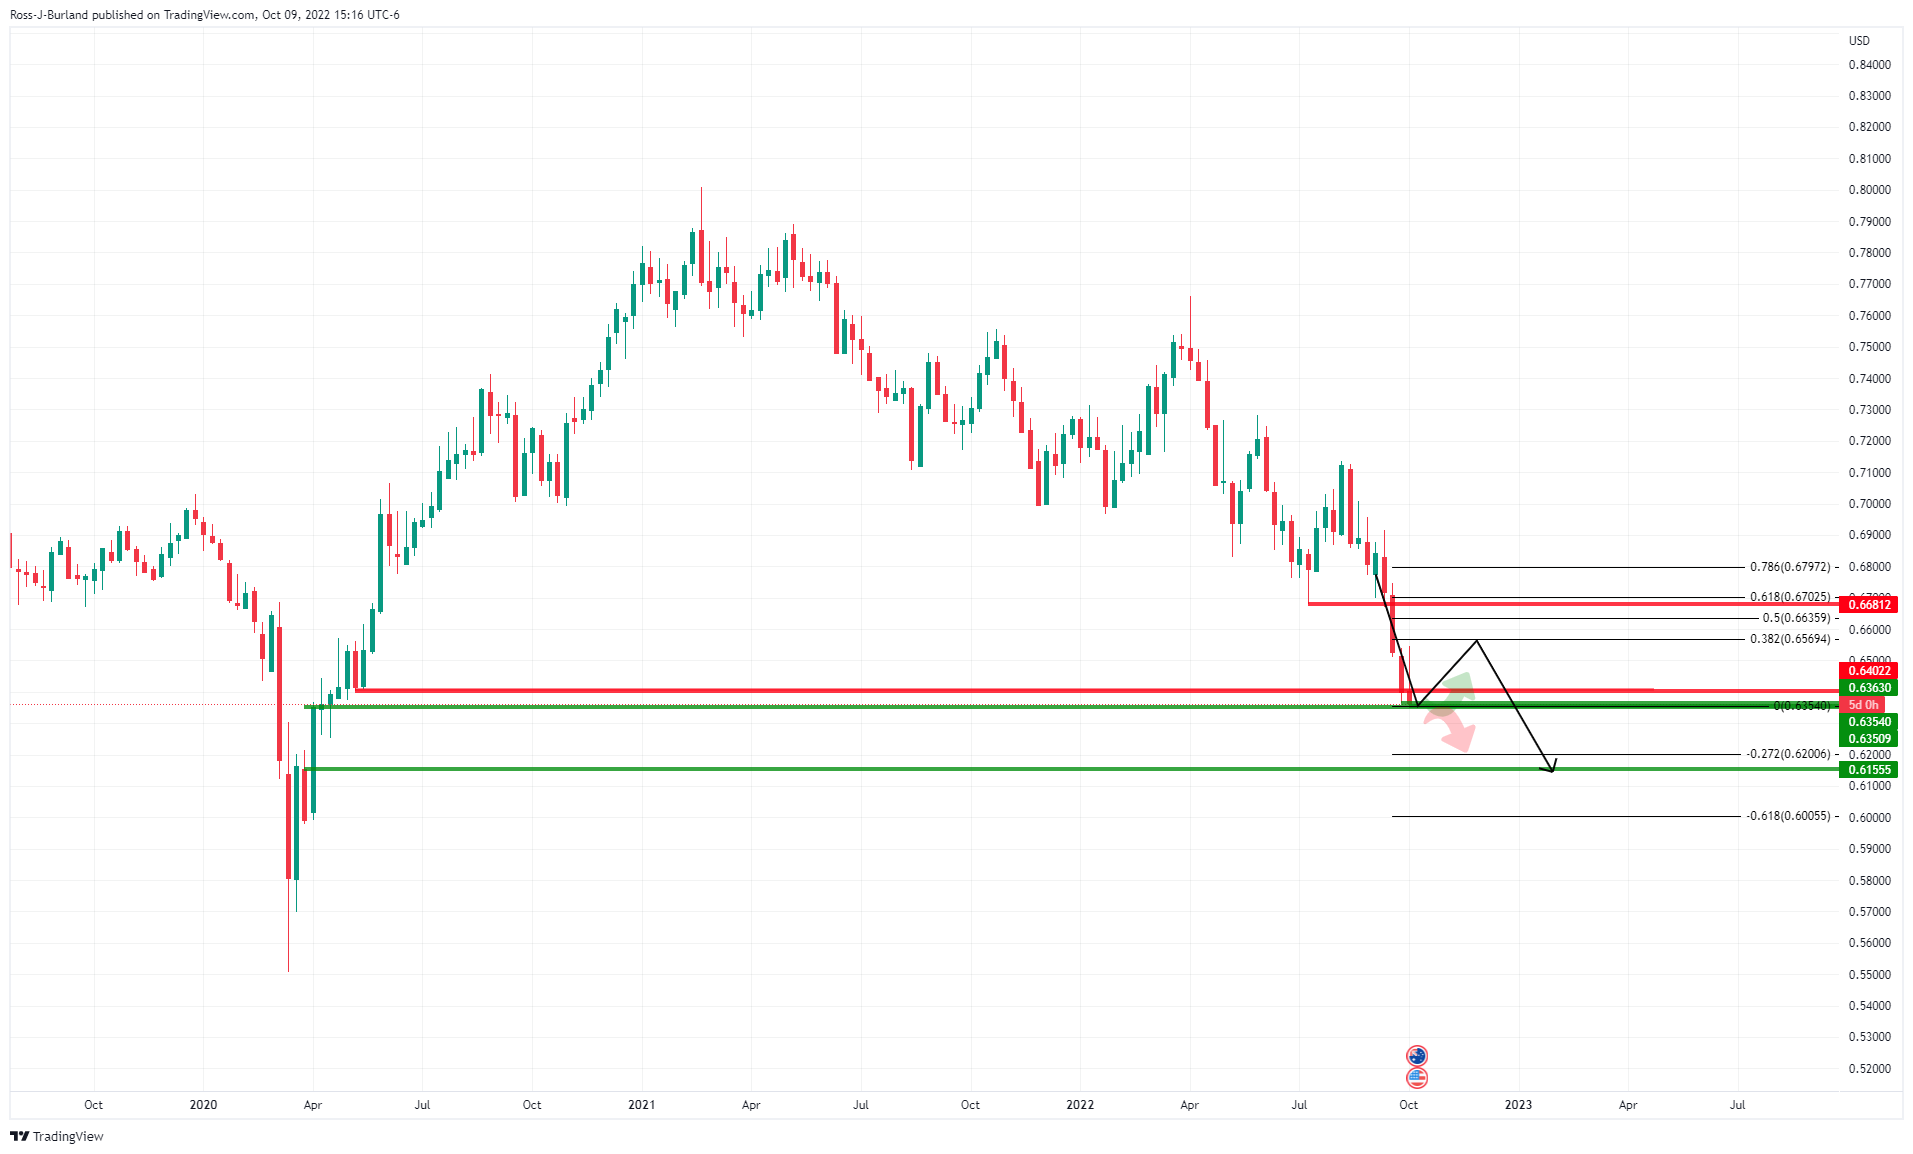
While there are prospects of a retracement of the weekly downtrend, the broader trend is lower. The Fibonacci scale can be drawn to look for confluences with structure. In this regard, the 61.8% aligns with the July lows near 0.6700. However, should the dollar remain strong, that will be a tall order to achieve.
AUD/USD daily chart
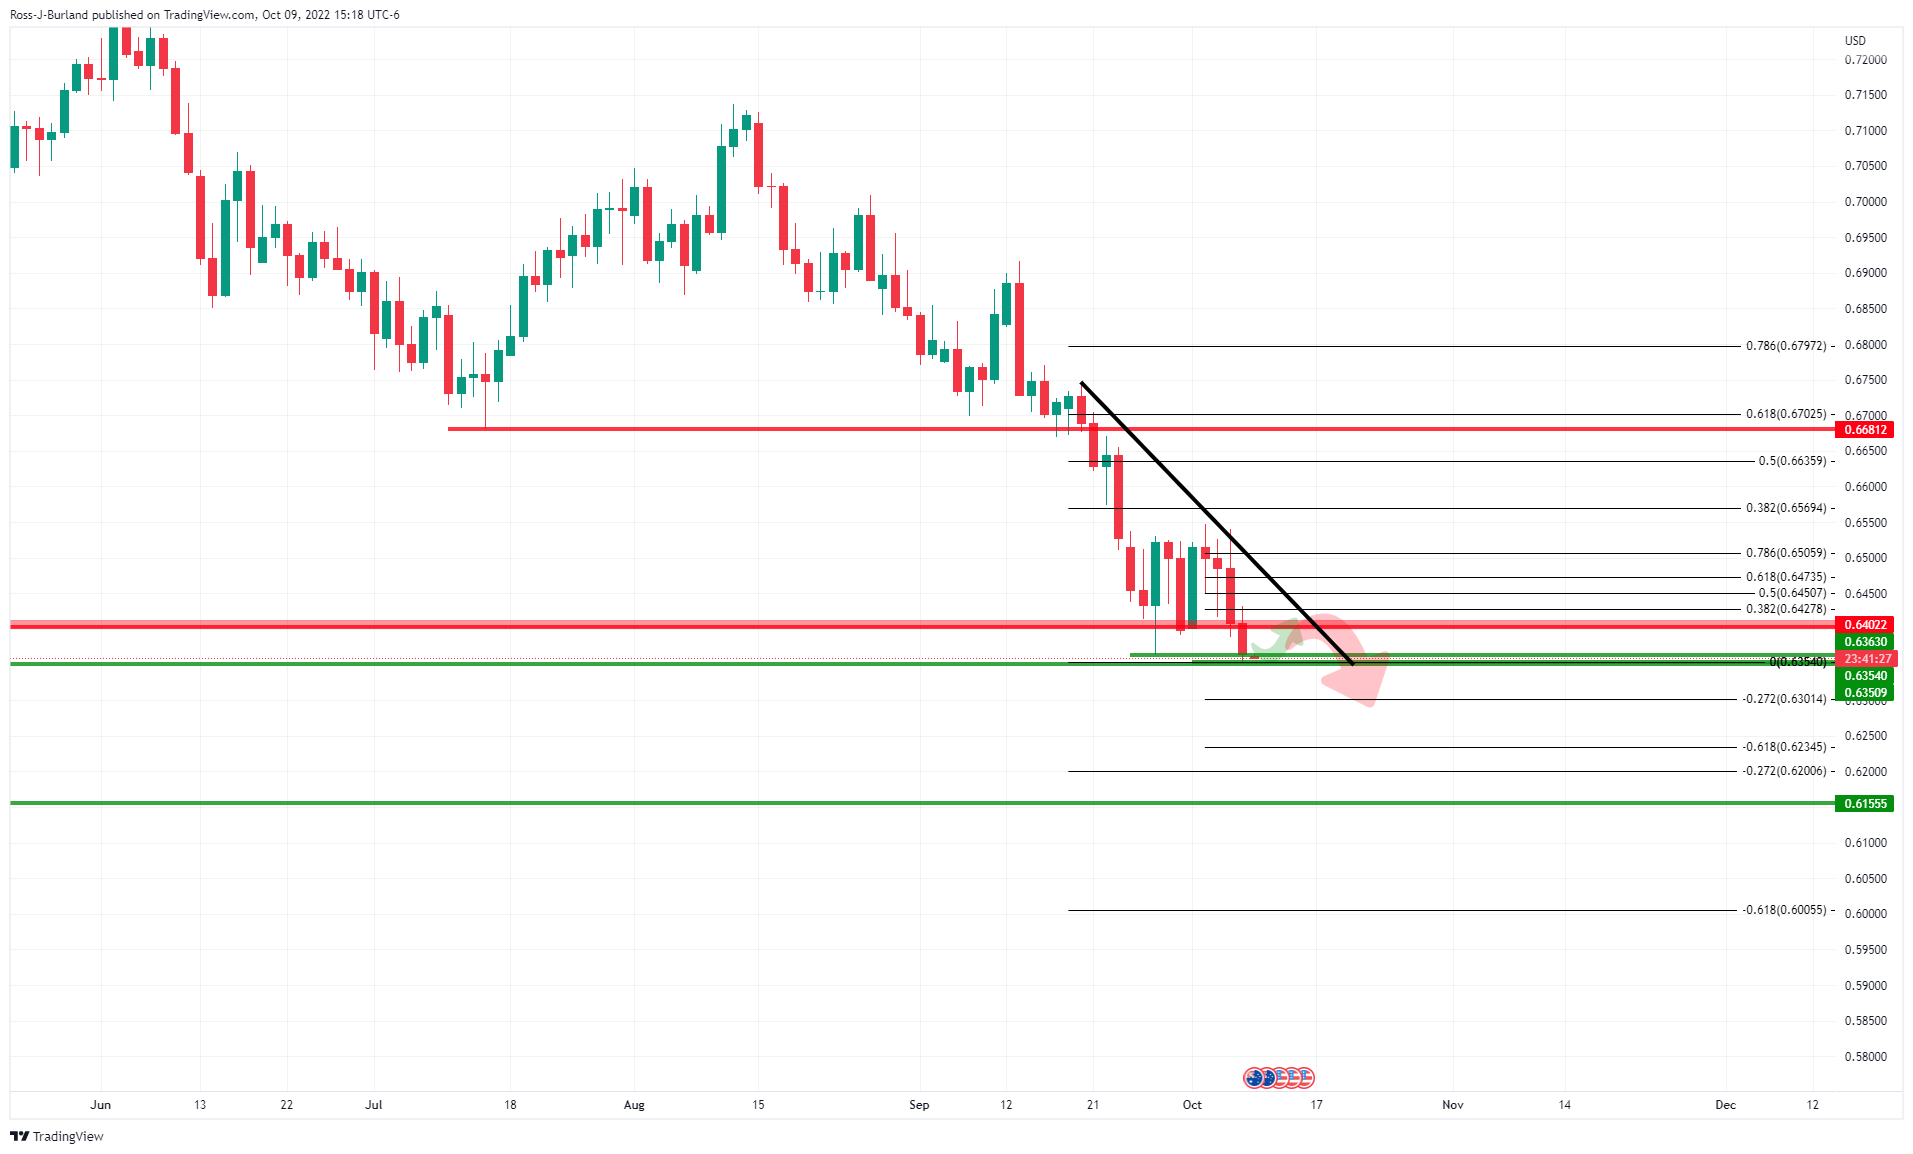
Moreover, the bulls will first need to overcome the daily resistance near 0.6550.
AUD/USD H4 chart
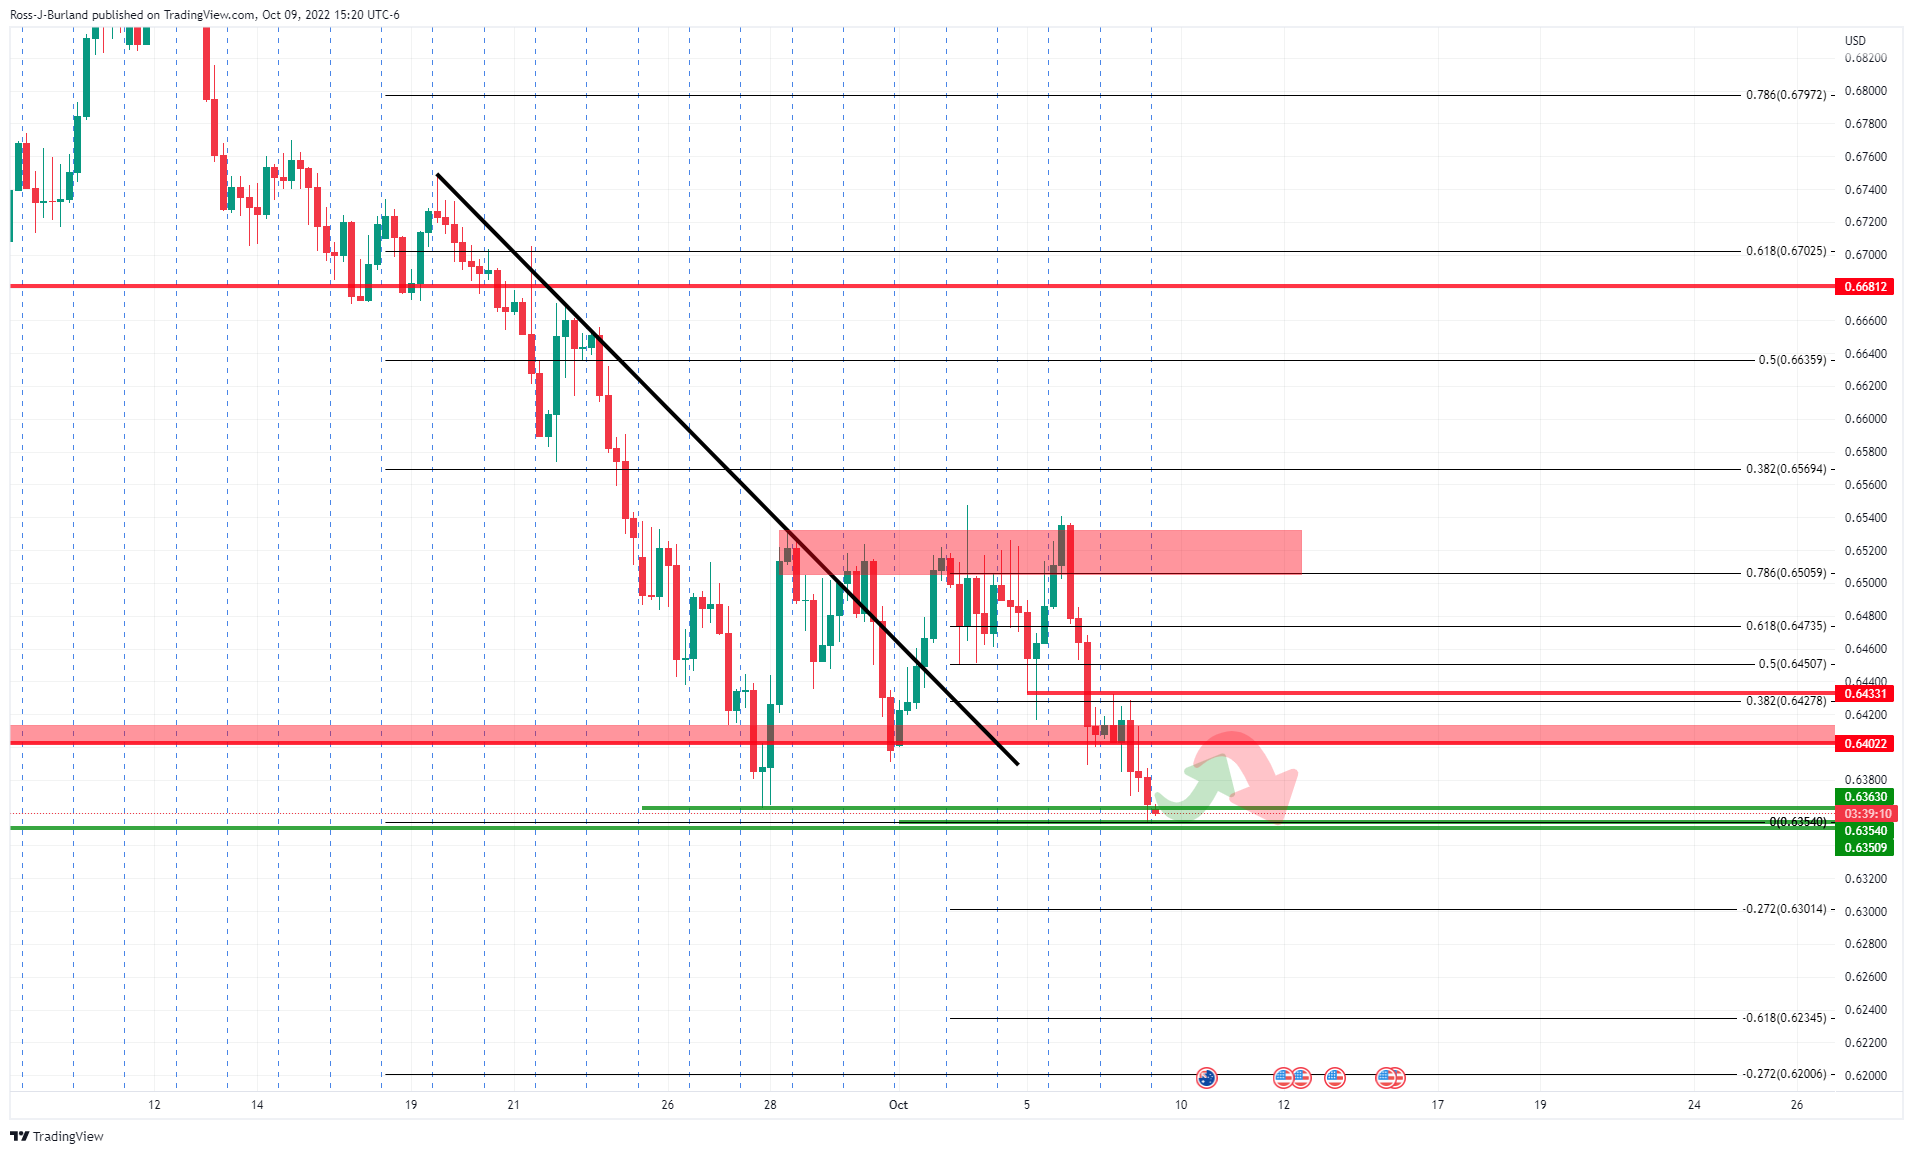
On the 4-hour time frame, the price has slid beyond the trendline resistance but is failing to hold convincingly within the channel. Nevertheless, bulls could be attracted at this stage for a discount so long as the support structure holds and the price can form a build-up of bullish candles for traders to lean into.
AUD/USD H1 chart
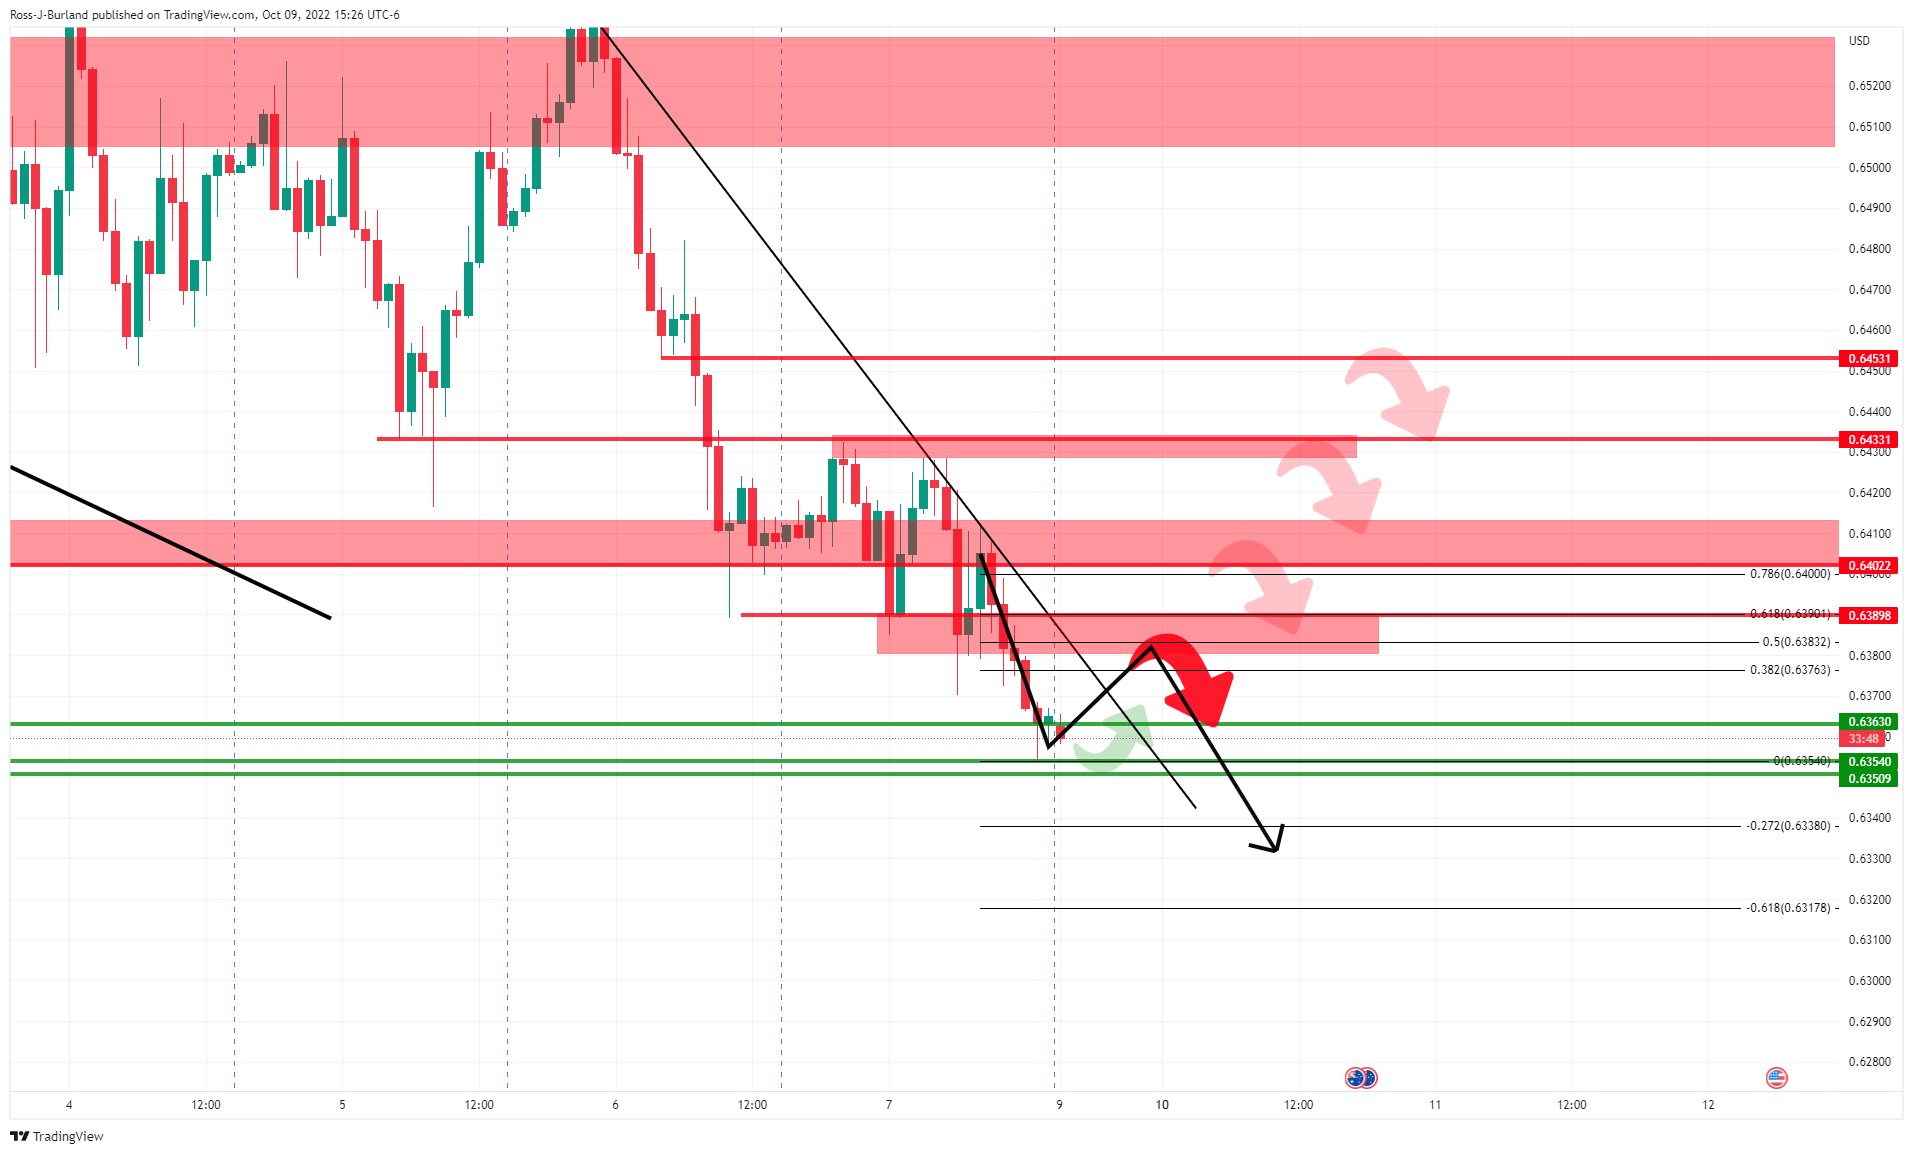
If the bulls do overcome the bears, there will be potentially strong resistance on the way up, as signified by the bearish arrows at key structural points along the way to the midpoint of the channel near 0.6450. This first hurdle comes at the confluence of the 38.2% Fibonacci and 50% mean reversion area near 0.6380/0.6400. A break there could be the most significant as it will open the way to higher levels.


© 2000-2026. Bản quyền Teletrade.
Trang web này được quản lý bởi Teletrade D.J. LLC 2351 LLC 2022 (Euro House, Richmond Hill Road, Kingstown, VC0100, St. Vincent and the Grenadines).
Thông tin trên trang web không phải là cơ sở để đưa ra quyết định đầu tư và chỉ được cung cấp cho mục đích làm quen.
Giao dịch trên thị trường tài chính (đặc biệt là giao dịch sử dụng các công cụ biên) mở ra những cơ hội lớn và tạo điều kiện cho các nhà đầu tư sẵn sàng mạo hiểm để thu lợi nhuận, tuy nhiên nó mang trong mình nguy cơ rủi ro khá cao. Chính vì vậy trước khi tiến hành giao dịch cần phải xem xét mọi mặt vấn đề chấp nhận tiến hành giao dịch cụ thể xét theo quan điểm của nguồn lực tài chính sẵn có và mức độ am hiểu thị trường tài chính.
Sử dụng thông tin: sử dụng toàn bộ hay riêng biệt các dữ liệu trên trang web của công ty TeleTrade như một nguồn cung cấp thông tin nhất định. Việc sử dụng tư liệu từ trang web cần kèm theo liên kết đến trang teletrade.vn. Việc tự động thu thập số liệu cũng như thông tin từ trang web TeleTrade đều không được phép.
Xin vui lòng liên hệ với pr@teletrade.global nếu có câu hỏi.
ngân hàng