- Phân tích
- Tin tức và các công cụ
- Tin tức thị trường
- Gold Price Forecast: XAU/USD eyes smoother road to the south of $1,700 – Confluence Detector
Gold Price Forecast: XAU/USD eyes smoother road to the south of $1,700 – Confluence Detector
- Gold price remains pressured near one-week low, pokes $1,960 key support.
- Firmer DXY, yields keep XAU/USD bears hopeful ahead of the Fed Minutes, US CPI.
- Downside appears more compelling as gold fade corrective bound off the yearly low.
Gold price (XAU/USD) remains on the back foot for the fourth consecutive day as bears brace for the fresh yearly bottom, around a one-weekly low. That said, the yellow metal’s latest weakness could be linked to the US dollar’s strength, backed by the multi-year high Treasury yields and hawkish Fed bets. It’s worth noting that the fears of economic slowdown and recently mixed Fedspeak failed to turn down the greenback bulls as markets price in 75 basis points (bps) of the Fed’s rate hike during November. Elsewhere, grim comments from the World Bank (WB) and the International Monetary Fund (IMF) join the recently fierce Russia-Ukraine tussle to amplify the risk-off mood and direct traders towards the US dollar, which in turn weigh on the XAU/USD prices.
While the risk aversion joins hawkish Fed bets to weigh on the bullion, the bears may keep the reins ahead of the Federal Open Market Committee (FOMC) Meeting Minutes and the US Consumer Price Index (CPI) data for September, up for publishing on Wednesday and Thursday respectively.
Also read: Gold Price Forecast: XAU/USD could threaten $1,650 if risk-aversion heightens
Gold Price: Key levels to watch
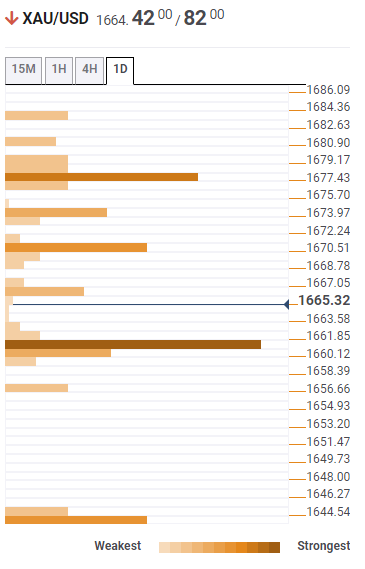
The Technical Confluence Detector shows that the gold price floats above the $1,661 key support comprising Fibonacci 38.2% on monthly and the pivot point one-week S1. Also increasing strength of the $1,661 support is the lower band of the hourly Bollinger and the previous low of the 4H.
It should be noted that there prevails a wide gap to the south past $1,661 unless it hits a small bump near the $1,644 level that includes Fibonacci 23.6% on monthly and the pivot point one-day S2.
Meanwhile, the middle band of the hourly Bollinger, near $1,670, guards the XAU/USD quote’s immediate upside.
Following that, the previous yearly low near $1,678appears the last defense for the gold bears.
Should the bullion crosses the $1,678 hurdle, the odds of its run-up toward the $1,700 threshold can’t be ruled out.
Here is how it looks on the tool
About Technical Confluences Detector
The TCD (Technical Confluences Detector) is a tool to locate and point out those price levels where there is a congestion of indicators, moving averages, Fibonacci levels, Pivot Points, etc. If you are a short-term trader, you will find entry points for counter-trend strategies and hunt a few points at a time. If you are a medium-to-long-term trader, this tool will allow you to know in advance the price levels where a medium-to-long-term trend may stop and rest, where to unwind positions, or where to increase your position size.


© 2000-2026. Bản quyền Teletrade.
Trang web này được quản lý bởi Teletrade D.J. LLC 2351 LLC 2022 (Euro House, Richmond Hill Road, Kingstown, VC0100, St. Vincent and the Grenadines).
Thông tin trên trang web không phải là cơ sở để đưa ra quyết định đầu tư và chỉ được cung cấp cho mục đích làm quen.
Giao dịch trên thị trường tài chính (đặc biệt là giao dịch sử dụng các công cụ biên) mở ra những cơ hội lớn và tạo điều kiện cho các nhà đầu tư sẵn sàng mạo hiểm để thu lợi nhuận, tuy nhiên nó mang trong mình nguy cơ rủi ro khá cao. Chính vì vậy trước khi tiến hành giao dịch cần phải xem xét mọi mặt vấn đề chấp nhận tiến hành giao dịch cụ thể xét theo quan điểm của nguồn lực tài chính sẵn có và mức độ am hiểu thị trường tài chính.
Sử dụng thông tin: sử dụng toàn bộ hay riêng biệt các dữ liệu trên trang web của công ty TeleTrade như một nguồn cung cấp thông tin nhất định. Việc sử dụng tư liệu từ trang web cần kèm theo liên kết đến trang teletrade.vn. Việc tự động thu thập số liệu cũng như thông tin từ trang web TeleTrade đều không được phép.
Xin vui lòng liên hệ với pr@teletrade.global nếu có câu hỏi.
ngân hàng