- Phân tích
- Tin tức và các công cụ
- Tin tức thị trường
- Gold Price Forecast: XAU/USD bulls aim for $1,680 – Confluence Detector
Gold Price Forecast: XAU/USD bulls aim for $1,680 – Confluence Detector
- Gold price extends the week-start recovery towards a short-term key hurdle.
- Risk-on mood weighs on DXY despite hawkish Fed bets, US inflation expectations.
- Lack of major directives facilitates the extension of the previous trend even as central banks, recession woes test XAU/USD.
Gold price (XAU/USD) remains on the front foot for the second consecutive day amid firmer market sentiment during early Tuesday. The metal’s latest recovery takes clues from the receding fears of the UK’s market collapse after the British Chancellor reversed the previous promises. Also favoring the yellow metal could be a lack of major data/events, as well as hopes of further stimulus from Japan, China and the UK. It’s worth noting that the chatters surrounding the easing recession woes in the bloc and hawkish comments from the European Central Bank (ECB) policymakers also contributed to the precious metal’s latest strength.
Moving on, a light calendar can keep XAU/USD buyers in command, considering the softer greenback. However, any negative surprises for the risk profile won’t be taken lightly as the latest recovery in prices remain doubtful, especially amid the hawkish central banks and recession woes.
Also read: Gold Price Forecast: XAU/USD defends the new support at $1,644, but for how long?
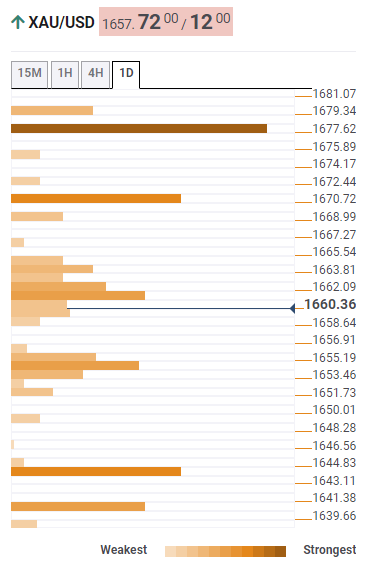
Gold Price: Key levels to watch
The Technical Confluence Detector shows that the gold price is approaching the immediate resistance placed at $1,669, comprising Bollinger Band one-day Middle.
Following that, a convergence of the previous yearly low, 200-HMA and Fibonacci 61.8% on weekly constitute a tough nut to crack for the XAU/USD buyers around $1,679.
It’s worth noting, however, that a clear upside break of $1,679, as well as the $1,680 round figure, will need validation from the mid-month top surrounding $1,683 before directing the bulls toward the $1,700 threshold.
Alternatively, Fibonacci 23.6% on weekly and 50-HMA offers immediate support to the metal during the pullback moves around $1,655.
In a case where the commodity prices drop below $1,655, the previous daily low and Fibonacci 23.6% in one month could challenge the gold bears to around $1,643.
Here is how it looks on the tool
About Technical Confluences Detector
The TCD (Technical Confluences Detector) is a tool to locate and point out those price levels where there is a congestion of indicators, moving averages, Fibonacci levels, Pivot Points, etc. If you are a short-term trader, you will find entry points for counter-trend strategies and hunt a few points at a time. If you are a medium-to-long-term trader, this tool will allow you to know in advance the price levels where a medium-to-long-term trend may stop and rest, where to unwind positions, or where to increase your position size.


© 2000-2026. Bản quyền Teletrade.
Trang web này được quản lý bởi Teletrade D.J. LLC 2351 LLC 2022 (Euro House, Richmond Hill Road, Kingstown, VC0100, St. Vincent and the Grenadines).
Thông tin trên trang web không phải là cơ sở để đưa ra quyết định đầu tư và chỉ được cung cấp cho mục đích làm quen.
Giao dịch trên thị trường tài chính (đặc biệt là giao dịch sử dụng các công cụ biên) mở ra những cơ hội lớn và tạo điều kiện cho các nhà đầu tư sẵn sàng mạo hiểm để thu lợi nhuận, tuy nhiên nó mang trong mình nguy cơ rủi ro khá cao. Chính vì vậy trước khi tiến hành giao dịch cần phải xem xét mọi mặt vấn đề chấp nhận tiến hành giao dịch cụ thể xét theo quan điểm của nguồn lực tài chính sẵn có và mức độ am hiểu thị trường tài chính.
Sử dụng thông tin: sử dụng toàn bộ hay riêng biệt các dữ liệu trên trang web của công ty TeleTrade như một nguồn cung cấp thông tin nhất định. Việc sử dụng tư liệu từ trang web cần kèm theo liên kết đến trang teletrade.vn. Việc tự động thu thập số liệu cũng như thông tin từ trang web TeleTrade đều không được phép.
Xin vui lòng liên hệ với pr@teletrade.global nếu có câu hỏi.
ngân hàng