- Phân tích
- Tin tức và các công cụ
- Tin tức thị trường
- EUR/JPY Price Analysis: Climbs above 147.00, refreshing 8-year highs, as buyers target 150.00
EUR/JPY Price Analysis: Climbs above 147.00, refreshing 8-year highs, as buyers target 150.00
- EUR/JPY printed a fresh YTD high above 147.00 as buyers eye December’s 2014 high.
- A risk-on impulse keeps safe-haven currencies, like the yen, on the defensive.
- EUR/JPY Price Analysis: Negative divergence in the daily and hourly charts to pave the way for a correction towards 145.00.
The EUR/JPY continues extending its gains, eyeing December’s 2013 high of 149.78, while the Japanese yen continues to weaken, despite further verbal interventions by Japanese authorities, which have failed to move the markets in favor of the battered yen. At the time of writing, the EUR/JPY is trading at 147.04. shy of the YTD high of 147.12.
Sentiment-wise, investors’ mood is upbeat, as portrayed by European bourses closing in the green, while US stocks followed suit. Therefore, safe-haven currencies like the Japanese yen, and the Swiss franc, would remain the weakest links in favor of other G8 currencies.
EUR/JPY Price Analysis
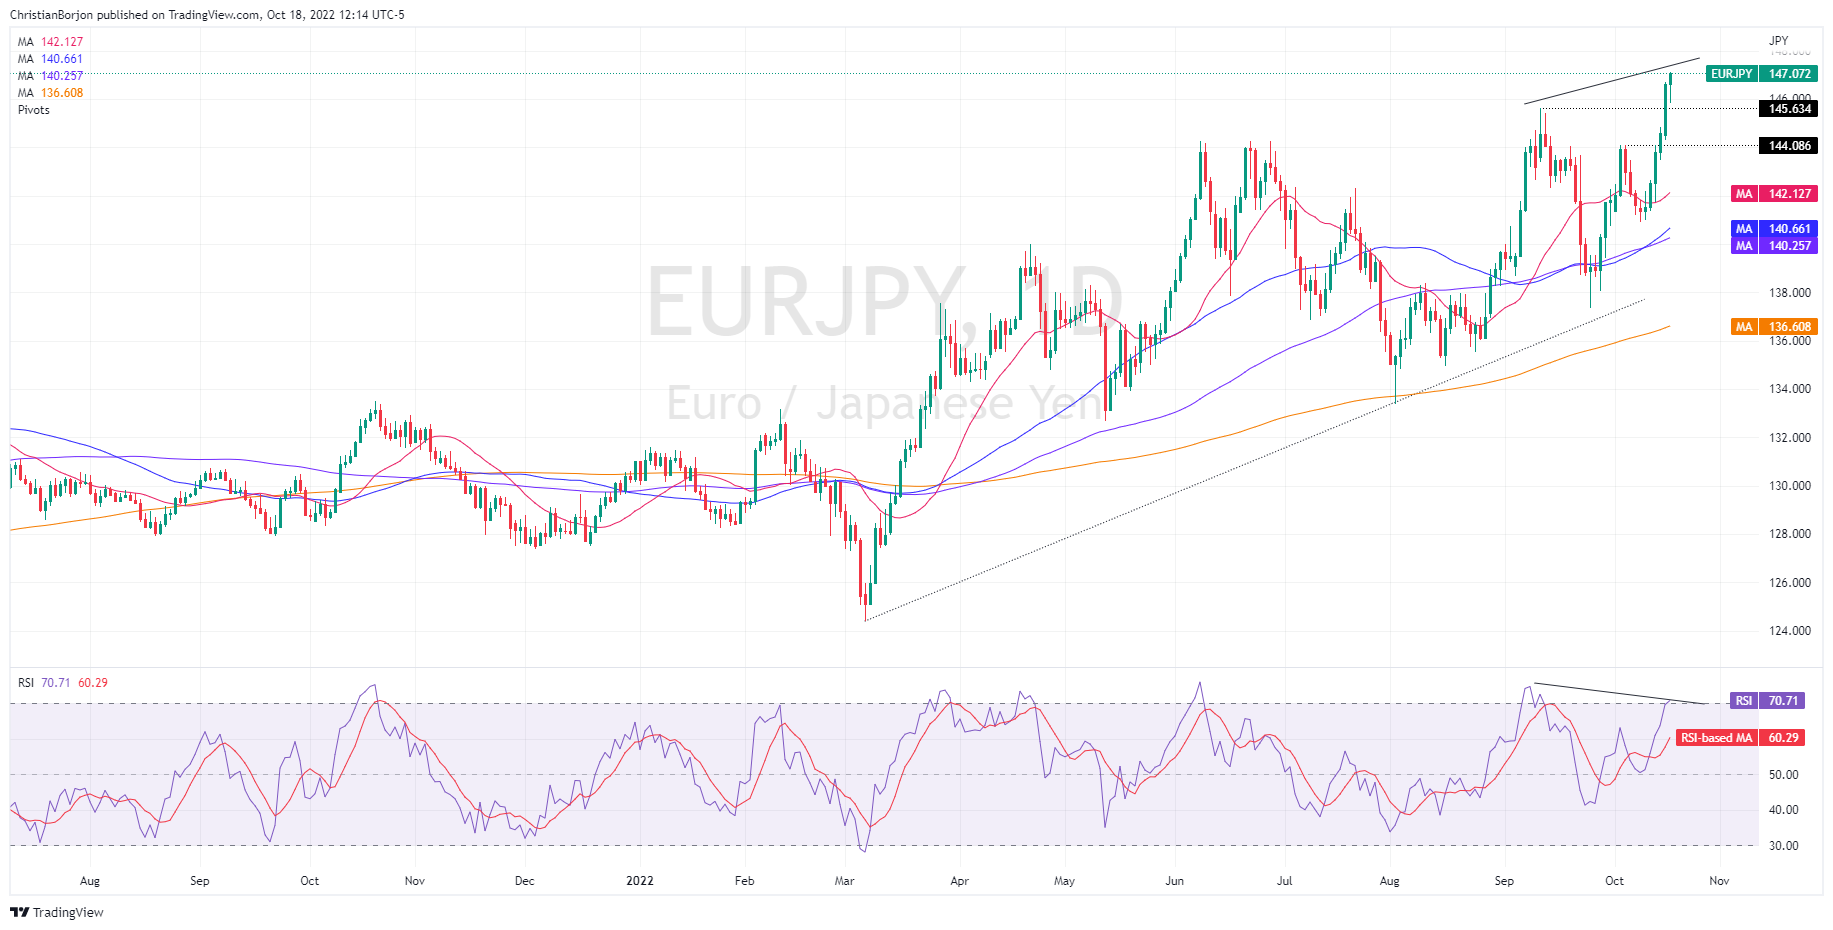
The daily chart shows that the EUR/JPY is upward biased. On Monday, the cross-currency pair broke into fresh eight-year highs and, earlier in the North American session, reached a YTD high at 147.12. Of note is that as the EUR/JPY climbs, registering higher highs, the Relative Strength Index (RSI) didn’t, so a negative divergence between RSI and price action could pave the way for a mean-reversion move before continuing to rally.
Hence, the EUR/JPY first support would be the September 12 daily high at 145.63. Break below will expose the October 5 cycle high-turned-support at 144.08, ahead of the 20-day EMA at 142.12.
EUR/JPY Daily chart
In the near term, the EUR/JPY one-hour chart shows price action as overextended, registering higher highs, while the RSI prints lower highs, as in the daily chart. Therefore, a negative divergence surfaced, opening the door for a correction.
Therefore, the EUR/JPY first support would be the 20-EMA at 14.70, which, once cleared, would expose a busy area, with the confluence of the daily low, the 50-EMA, and the central pivot point at around 145.84. A breach of the latter will expose the S1 pivot at around 145.00.
EUR/JPY Hourly chart

EUR/JPY Key Technical Levels


© 2000-2026. Bản quyền Teletrade.
Trang web này được quản lý bởi Teletrade D.J. LLC 2351 LLC 2022 (Euro House, Richmond Hill Road, Kingstown, VC0100, St. Vincent and the Grenadines).
Thông tin trên trang web không phải là cơ sở để đưa ra quyết định đầu tư và chỉ được cung cấp cho mục đích làm quen.
Giao dịch trên thị trường tài chính (đặc biệt là giao dịch sử dụng các công cụ biên) mở ra những cơ hội lớn và tạo điều kiện cho các nhà đầu tư sẵn sàng mạo hiểm để thu lợi nhuận, tuy nhiên nó mang trong mình nguy cơ rủi ro khá cao. Chính vì vậy trước khi tiến hành giao dịch cần phải xem xét mọi mặt vấn đề chấp nhận tiến hành giao dịch cụ thể xét theo quan điểm của nguồn lực tài chính sẵn có và mức độ am hiểu thị trường tài chính.
Sử dụng thông tin: sử dụng toàn bộ hay riêng biệt các dữ liệu trên trang web của công ty TeleTrade như một nguồn cung cấp thông tin nhất định. Việc sử dụng tư liệu từ trang web cần kèm theo liên kết đến trang teletrade.vn. Việc tự động thu thập số liệu cũng như thông tin từ trang web TeleTrade đều không được phép.
Xin vui lòng liên hệ với pr@teletrade.global nếu có câu hỏi.
ngân hàng