- Phân tích
- Tin tức và các công cụ
- Tin tức thị trường
- Gold Price Forecast: XAU/USD eyes $1,615 and $1,607 amid a down week – Confluence Detector
Gold Price Forecast: XAU/USD eyes $1,615 and $1,607 amid a down week – Confluence Detector
- Gold price is on track for the second straight weekly loss amid surging Treasury yields.
- The US dollar jumps back into the game on risk-aversion and aggressive Fed rate hike bets.
- XAU/USD’s path of least resistance remains to the downside, with eyes on $1,607.
Gold price is testing bullish commitments near 2022 lows on its way to the $1,600 threshold heading into a new week. The Fed entered the blackout period ahead of its November 2 rate hike decision. Therefore, the recent speeches from Fed policymakers and a surprise drop in the US Jobless Claims data had a significant impact on the aggressive Fed rate hike expectations. The US Treasury yields shot through the roof, thereafter, driving the dollar northward alongside, throwing the metal under the bus. The parabolic rise in the USD/JPY pair on policy divergence is also benefiting dollar bulls. The bullion is headed for the second consecutive weekly decline, as higher borrowing costs continue denting the yieldless metal. All eyes now turn towards a fresh batch of top-tier US economic data due for release in the week ahead.
Also read: Gold Price Forecast: XAU/USD eyes a sustained break below $1,615 as yields keep rallying
Gold Price: Key levels to watch
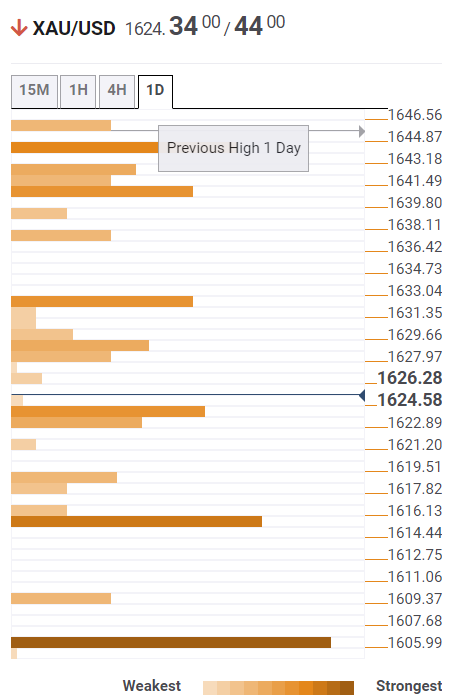
The Technical Confluence Detector shows that the gold price is likely to find footing below the previous day’s low of $1,623, despite the renewed uptick.
The pivot point one-day S1 at $1,618 could come to the rescue of buyers before they look to attack the previous month’s low of $1,615.
A sustained break below the latter will open up downside towards the critical cap at the pivot point one-month S1 at $1,607. Ahead of that, the pivot point one-day S2 at $1,609 could offer temporary support.
Alternatively, gold price needs to find acceptance above the confluence of the Fibonacci 23.6% one-day and SMA5 four-hour at $1,628 on its recovery. The next powerful barrier is seen at the Fibonacci 38.2% one-day at $1,632.
Further up, the Fibonacci 61.8% one-day at $1,637 would be a tough nut to crack for XAU buyers.
Here is how it looks on the tool
About Technical Confluences Detector
The TCD (Technical Confluences Detector) is a tool to locate and point out those price levels where there is a congestion of indicators, moving averages, Fibonacci levels, Pivot Points, etc. If you are a short-term trader, you will find entry points for counter-trend strategies and hunt a few points at a time. If you are a medium-to-long-term trader, this tool will allow you to know in advance the price levels where a medium-to-long-term trend may stop and rest, where to unwind positions, or where to increase your position size.


© 2000-2026. Bản quyền Teletrade.
Trang web này được quản lý bởi Teletrade D.J. LLC 2351 LLC 2022 (Euro House, Richmond Hill Road, Kingstown, VC0100, St. Vincent and the Grenadines).
Thông tin trên trang web không phải là cơ sở để đưa ra quyết định đầu tư và chỉ được cung cấp cho mục đích làm quen.
Giao dịch trên thị trường tài chính (đặc biệt là giao dịch sử dụng các công cụ biên) mở ra những cơ hội lớn và tạo điều kiện cho các nhà đầu tư sẵn sàng mạo hiểm để thu lợi nhuận, tuy nhiên nó mang trong mình nguy cơ rủi ro khá cao. Chính vì vậy trước khi tiến hành giao dịch cần phải xem xét mọi mặt vấn đề chấp nhận tiến hành giao dịch cụ thể xét theo quan điểm của nguồn lực tài chính sẵn có và mức độ am hiểu thị trường tài chính.
Sử dụng thông tin: sử dụng toàn bộ hay riêng biệt các dữ liệu trên trang web của công ty TeleTrade như một nguồn cung cấp thông tin nhất định. Việc sử dụng tư liệu từ trang web cần kèm theo liên kết đến trang teletrade.vn. Việc tự động thu thập số liệu cũng như thông tin từ trang web TeleTrade đều không được phép.
Xin vui lòng liên hệ với pr@teletrade.global nếu có câu hỏi.
ngân hàng