- Phân tích
- Tin tức và các công cụ
- Tin tức thị trường
- Gold Price Forecast: XAUUSD eyes $1,736 and $1,730 as next downside targets – Confluence Detector
Gold Price Forecast: XAUUSD eyes $1,736 and $1,730 as next downside targets – Confluence Detector
- Gold price is extending its bearish streak at the start of the week.
- Hawkish Federal Reserve commentary and China’s covid woes boost the US Dollar.
- Gold price looks vulnerable following a weekly close below the $1,750 level.
Gold price is testing weekly lows below $1,750, in a negative start to the week. The bright metal is extending its losing streak into a fourth straight trading day this Monday, as the US Dollar continues its recovery momentum, drawing the latest support from broad risk-aversion. Investors remain wary amid China’s covid restrictions and hawkish Fed outlook on the terminal rates. Two covid deaths reported in Beijing combined with a five-day lockdown in Guanzhou has once again spooked markets. Meanwhile, Atlanta Federal Reserve President Raphael Bostic said on Saturday that he feels the Fed's target policy rate needs to rise no more than another percentage point to tackle inflation. Looking ahead, markets await the Federal Reserve November meeting minutes for fresh hints on the central bank’s policy outlook.
Also read: Gold, Chart of the Week: XAUUSD bears are moving in, focus is on $1,750, then $1,720
Gold Price: Key levels to watch
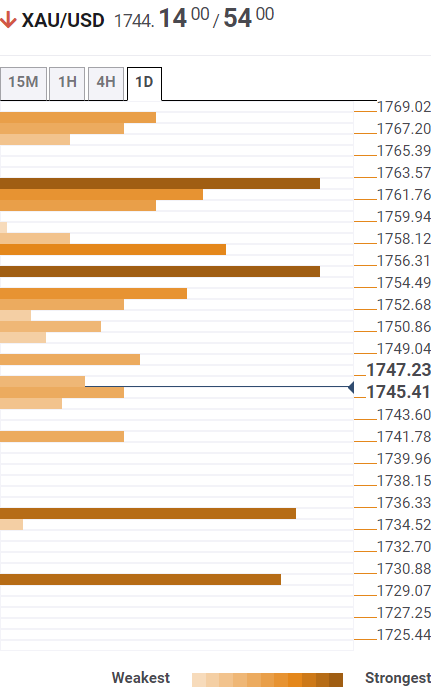
The Technical Confluence Detector shows that the gold price is flirting with the SMA10 one-day at $1,745 following a weekly close below the $1,750 psychological barrier.
A breach of the pivot point one-day S1 at $1,742 is likely to open floors for a test of the $1,736 demand area. That zone is the convergence of the pivot point one-day S2 and the pivot point one-week S1.
The last line of defense for gold buyers is seen at $1,730, which is the previous month’s high.
On the flip side, the immediate resistance is aligned at the previous day’s low of $1,748, above which the $1,750 level will be retested.
Acceptance above the latter will threaten the Fibonacci 23.6% one-day resistance at $1,753.
Gold bulls need to take out the powerful resistance at around $1,755, which is the confluence of the Fibonacci 38.2% one-day and SMA50 four-hour.
Here is how it looks on the tool
About Technical Confluences Detector
The TCD (Technical Confluences Detector) is a tool to locate and point out those price levels where there is a congestion of indicators, moving averages, Fibonacci levels, Pivot Points, etc. If you are a short-term trader, you will find entry points for counter-trend strategies and hunt a few points at a time. If you are a medium-to-long-term trader, this tool will allow you to know in advance the price levels where a medium-to-long-term trend may stop and rest, where to unwind positions, or where to increase your position size.


© 2000-2026. Bản quyền Teletrade.
Trang web này được quản lý bởi Teletrade D.J. LLC 2351 LLC 2022 (Euro House, Richmond Hill Road, Kingstown, VC0100, St. Vincent and the Grenadines).
Thông tin trên trang web không phải là cơ sở để đưa ra quyết định đầu tư và chỉ được cung cấp cho mục đích làm quen.
Giao dịch trên thị trường tài chính (đặc biệt là giao dịch sử dụng các công cụ biên) mở ra những cơ hội lớn và tạo điều kiện cho các nhà đầu tư sẵn sàng mạo hiểm để thu lợi nhuận, tuy nhiên nó mang trong mình nguy cơ rủi ro khá cao. Chính vì vậy trước khi tiến hành giao dịch cần phải xem xét mọi mặt vấn đề chấp nhận tiến hành giao dịch cụ thể xét theo quan điểm của nguồn lực tài chính sẵn có và mức độ am hiểu thị trường tài chính.
Sử dụng thông tin: sử dụng toàn bộ hay riêng biệt các dữ liệu trên trang web của công ty TeleTrade như một nguồn cung cấp thông tin nhất định. Việc sử dụng tư liệu từ trang web cần kèm theo liên kết đến trang teletrade.vn. Việc tự động thu thập số liệu cũng như thông tin từ trang web TeleTrade đều không được phép.
Xin vui lòng liên hệ với pr@teletrade.global nếu có câu hỏi.
ngân hàng