- Phân tích
- Tin tức và các công cụ
- Tin tức thị trường
- Gold Price Forecast: XAU/USD upside opens up toward $1,775 on dovish Fed pivot – Confluence Detector
Gold Price Forecast: XAU/USD upside opens up toward $1,775 on dovish Fed pivot – Confluence Detector
- Gold price is rising for the third straight day on Thursday, having recaptured $1,750.
- Dovish Fed minutes and weak US data weigh on the US Dollar alongside US Treasury yields.
- Gold price faces an uphill battle on the upside, with eyes on the key $1,775 resistance.
Gold price is trading at the best levels seen so far this week, as bulls find fresh impetus after having recaptured the $1,750 psychological mark. The main reason behind the renewed upside in the bright metal is the extended US Dollar weakness in tandem with the US Treasury bond yields. Dovish US Federal Reserve minutes and weak United States PMIs and Jobless Claims data triggered a fresh sell-off in the US Dollar, as the US Tresaury yields tumbled across the curve amid increased expectations of smaller Fed rate hikes in the months ahead. The greenback ignored the Chinese coronavirus-led concerns, which kept the risk rally on the global stocks largely capped. Gold price could preserve recent gains amid Thanksgiving Day-driven thin market conditions, as the bias for the US Dollar remains to the downside.
Also read: Stagflation: The worse for US, the better for gold
Gold Price: Key levels to watch
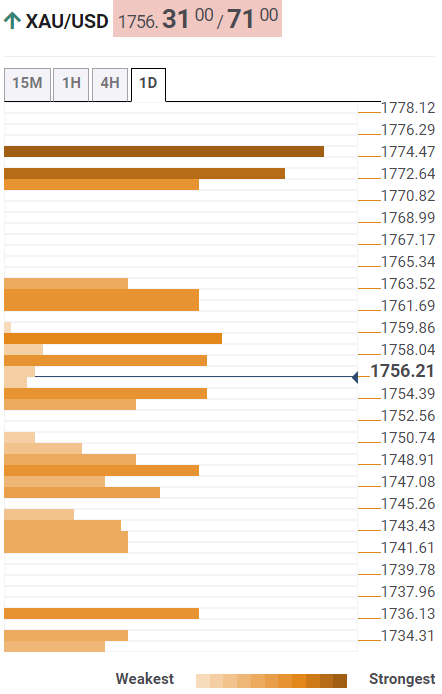
The Technical Confluence Detector shows that the gold price is struggling to take out a strong resistance at around $1,759, where the SMA10 one-day, Fibonacci 23.6% one-week and SMA50 four-hour coincide.
The next critical resistance is envisioned at $1,762, the intersection of the Fibonacci 38.2% one-week and pivot point one-day R1.
Acceptance above the latter will trigger a fresh rally toward the confluence of the Fibonacci 61.8% one-week and pivot point one-month R2 at $1,772.
Further up, the pivot point one-day R2 and one-week R1 at $1,775 will be put to test.
On the flip side, the immediate support is pegged at the previous day’s high of $1,753, below which the previous week’s low at $1,748 will come into play.
The line in the sand for Gold buyers is the $1,742 demand area, which is the Fibonacci 38.2% one-day.
Here is how it looks on the tool
About Technical Confluences Detector
The TCD (Technical Confluences Detector) is a tool to locate and point out those price levels where there is a congestion of indicators, moving averages, Fibonacci levels, Pivot Points, etc. If you are a short-term trader, you will find entry points for counter-trend strategies and hunt a few points at a time. If you are a medium-to-long-term trader, this tool will allow you to know in advance the price levels where a medium-to-long-term trend may stop and rest, where to unwind positions, or where to increase your position size.


© 2000-2026. Bản quyền Teletrade.
Trang web này được quản lý bởi Teletrade D.J. LLC 2351 LLC 2022 (Euro House, Richmond Hill Road, Kingstown, VC0100, St. Vincent and the Grenadines).
Thông tin trên trang web không phải là cơ sở để đưa ra quyết định đầu tư và chỉ được cung cấp cho mục đích làm quen.
Giao dịch trên thị trường tài chính (đặc biệt là giao dịch sử dụng các công cụ biên) mở ra những cơ hội lớn và tạo điều kiện cho các nhà đầu tư sẵn sàng mạo hiểm để thu lợi nhuận, tuy nhiên nó mang trong mình nguy cơ rủi ro khá cao. Chính vì vậy trước khi tiến hành giao dịch cần phải xem xét mọi mặt vấn đề chấp nhận tiến hành giao dịch cụ thể xét theo quan điểm của nguồn lực tài chính sẵn có và mức độ am hiểu thị trường tài chính.
Sử dụng thông tin: sử dụng toàn bộ hay riêng biệt các dữ liệu trên trang web của công ty TeleTrade như một nguồn cung cấp thông tin nhất định. Việc sử dụng tư liệu từ trang web cần kèm theo liên kết đến trang teletrade.vn. Việc tự động thu thập số liệu cũng như thông tin từ trang web TeleTrade đều không được phép.
Xin vui lòng liên hệ với pr@teletrade.global nếu có câu hỏi.
ngân hàng