- Phân tích
- Tin tức và các công cụ
- Tin tức thị trường
- Gold Price Forecast: XAU/USD looks to revisit $1,760 demand area – Confluence Detector
Gold Price Forecast: XAU/USD looks to revisit $1,760 demand area – Confluence Detector
- Gold price licks its wounds around below $1,800 as the US Dollar holds firm.
- Robust US economic data revive hawkish Federal Reserve tightening bets.
- Downside appears more compelling for Gold price after rejection above $1,800.
Gold price is consolidating a two-day downtrend below the $1,800 threshold, as bears gather strength before initiating a fresh leg lower. A quiet calendar is also contributing to the listless performance of Gold price. Meanwhile, investors turn cautious and help underpin the safe-haven demand for the US Dollar, in turn, capping the recovery attempts in the bright metal. The US Dollar continues to capitalize on the recent strong US ISM Services PMI and Factory Orders data, which have renewed expectations of more rate increases from the Federal Reserve (Fed), extending into the next year. However, stalled upside in the US Treasury yields across the curve is allowing Gold price stage a modest comeback. Amid a lack of top-tier US economic data and the Fed’s ‘blackout period’, the broad market sentiment and the Fed rate hike expectations will continue to play a pivotal role in influencing the USD-denominated Gold price.
Also read: Gold Price Forecast: XAU/USD risks further downside on renewed hawkish Federal Reserve view
Gold Price: Key levels to watch
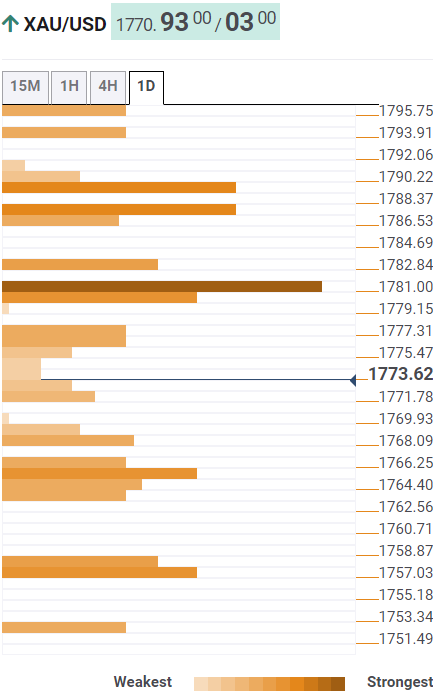
The Technical Confluence Detector shows that the gold price is eyeing a big break to the downside, targeting the initial support at the SMA50 four-hour at $1,768.
The next strong cushion is seen at around $1,765, the convergence of the Fibonacci 61.8% one-week, the previous day’s low and the SMA100 four-hour.
A sharp drop toward the pivot point one-week S1 at $1,758 cannot be ruled out if the abovementioned support fails to hold.
Alternatively, Gold buyers need to find a strong foothold above the confluence of the Fibonacci 23.6% one-day and SMA5 one-day at $1,777.
Further upside will open beyond a break of the Fibonacci 38.2% one-week at $1,781. The next stop for bulls is envisioned at the intersection of the Fibonacci 38.2% one-day and SMA100 one-hour at around $1,783.
Here is how it looks on the tool
About Technical Confluences Detector
The TCD (Technical Confluences Detector) is a tool to locate and point out those price levels where there is a congestion of indicators, moving averages, Fibonacci levels, Pivot Points, etc. If you are a short-term trader, you will find entry points for counter-trend strategies and hunt a few points at a time. If you are a medium-to-long-term trader, this tool will allow you to know in advance the price levels where a medium-to-long-term trend may stop and rest, where to unwind positions, or where to increase your position size.


© 2000-2026. Bản quyền Teletrade.
Trang web này được quản lý bởi Teletrade D.J. LLC 2351 LLC 2022 (Euro House, Richmond Hill Road, Kingstown, VC0100, St. Vincent and the Grenadines).
Thông tin trên trang web không phải là cơ sở để đưa ra quyết định đầu tư và chỉ được cung cấp cho mục đích làm quen.
Giao dịch trên thị trường tài chính (đặc biệt là giao dịch sử dụng các công cụ biên) mở ra những cơ hội lớn và tạo điều kiện cho các nhà đầu tư sẵn sàng mạo hiểm để thu lợi nhuận, tuy nhiên nó mang trong mình nguy cơ rủi ro khá cao. Chính vì vậy trước khi tiến hành giao dịch cần phải xem xét mọi mặt vấn đề chấp nhận tiến hành giao dịch cụ thể xét theo quan điểm của nguồn lực tài chính sẵn có và mức độ am hiểu thị trường tài chính.
Sử dụng thông tin: sử dụng toàn bộ hay riêng biệt các dữ liệu trên trang web của công ty TeleTrade như một nguồn cung cấp thông tin nhất định. Việc sử dụng tư liệu từ trang web cần kèm theo liên kết đến trang teletrade.vn. Việc tự động thu thập số liệu cũng như thông tin từ trang web TeleTrade đều không được phép.
Xin vui lòng liên hệ với pr@teletrade.global nếu có câu hỏi.
ngân hàng