- Phân tích
- Tin tức và các công cụ
- Tin tức thị trường
- Gold Price Forecast: $1,788 appears a tough nut to crack for XAU/USD bulls – Confluence Detector
Gold Price Forecast: $1,788 appears a tough nut to crack for XAU/USD bulls – Confluence Detector
- Gold price is finding fresh demand as US Dollar extends retreat.
- Hawkish Fed and ECB policy decisions could keep Gold price rebound short-lived.
- Focus shifts to next week’s US PCE inflation, as Gold price remains in a familiar range.
Gold price is attempting a tepid comeback following a massive sell-off witnessed on the back of the hawkish policy outlook adopted by the US Federal Reserve (Fed) and the European Central Bank (ECB) at their respective monetary policy meetings. Both central banks remain committed to keeping interest rates higher until inflation is brought down in a sustained manner. The non-interest-bearing Gold price tends to suffer in a higher interest rates environment. The latest bounce in the bright metal could be linked to the retreat in the US Dollar across the board, as the dust settles over the bumper central bankers’ events. As the Fed remains data-dependent, attention now turns toward the US PCE Price Index, the Fed’s preferred inflation, due next week for fresh hints on the US central banks’ future policy course.
Also read: The story about Gold and the Fed’s U-turn
Gold Price: Key levels to watch
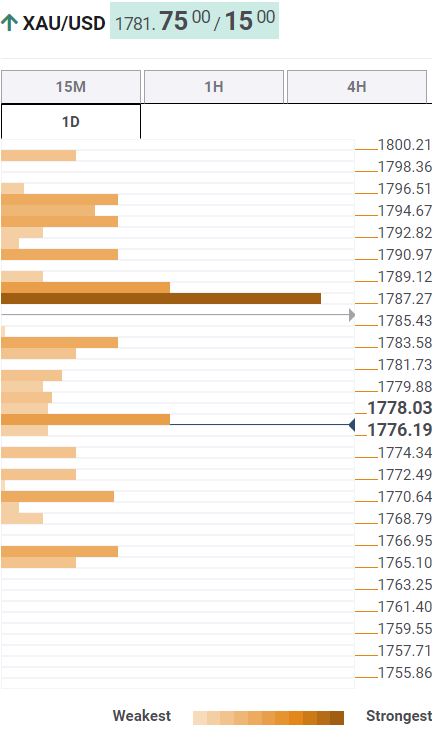
The Technical Confluence Detector shows that the gold price is looking to build its rebound toward the convergence of the Fibonacci 38.2% one-week and Fibonacci 236.6% one-day at $1,783.
A firm break above the latter will add extra zest to the recovery in Gold price, allowing a test of the powerful resistance at around $1,788. That level is the confluence of the previous month’s high, SMA200 one-day, Fibonacci 38.2% one-day and SMA10 one-day.
The next significant upside barrier is seen around $1,793, where the Fibonacci 61.8% one-day and SMA5 one-day coincide.
Alternatively, strong support awaits at the Fibonacci 23.6% one-week at $1,777, below which the previous day’s low at $1,774 will get retested.
The last line of defense for Gold bulls is seen at the previous week’s low at $1,766.
Here is how it looks on the tool
About Technical Confluences Detector
The TCD (Technical Confluences Detector) is a tool to locate and point out those price levels where there is a congestion of indicators, moving averages, Fibonacci levels, Pivot Points, etc. If you are a short-term trader, you will find entry points for counter-trend strategies and hunt a few points at a time. If you are a medium-to-long-term trader, this tool will allow you to know in advance the price levels where a medium-to-long-term trend may stop and rest, where to unwind positions, or where to increase your position size.


© 2000-2026. Bản quyền Teletrade.
Trang web này được quản lý bởi Teletrade D.J. LLC 2351 LLC 2022 (Euro House, Richmond Hill Road, Kingstown, VC0100, St. Vincent and the Grenadines).
Thông tin trên trang web không phải là cơ sở để đưa ra quyết định đầu tư và chỉ được cung cấp cho mục đích làm quen.
Giao dịch trên thị trường tài chính (đặc biệt là giao dịch sử dụng các công cụ biên) mở ra những cơ hội lớn và tạo điều kiện cho các nhà đầu tư sẵn sàng mạo hiểm để thu lợi nhuận, tuy nhiên nó mang trong mình nguy cơ rủi ro khá cao. Chính vì vậy trước khi tiến hành giao dịch cần phải xem xét mọi mặt vấn đề chấp nhận tiến hành giao dịch cụ thể xét theo quan điểm của nguồn lực tài chính sẵn có và mức độ am hiểu thị trường tài chính.
Sử dụng thông tin: sử dụng toàn bộ hay riêng biệt các dữ liệu trên trang web của công ty TeleTrade như một nguồn cung cấp thông tin nhất định. Việc sử dụng tư liệu từ trang web cần kèm theo liên kết đến trang teletrade.vn. Việc tự động thu thập số liệu cũng như thông tin từ trang web TeleTrade đều không được phép.
Xin vui lòng liên hệ với pr@teletrade.global nếu có câu hỏi.
ngân hàng